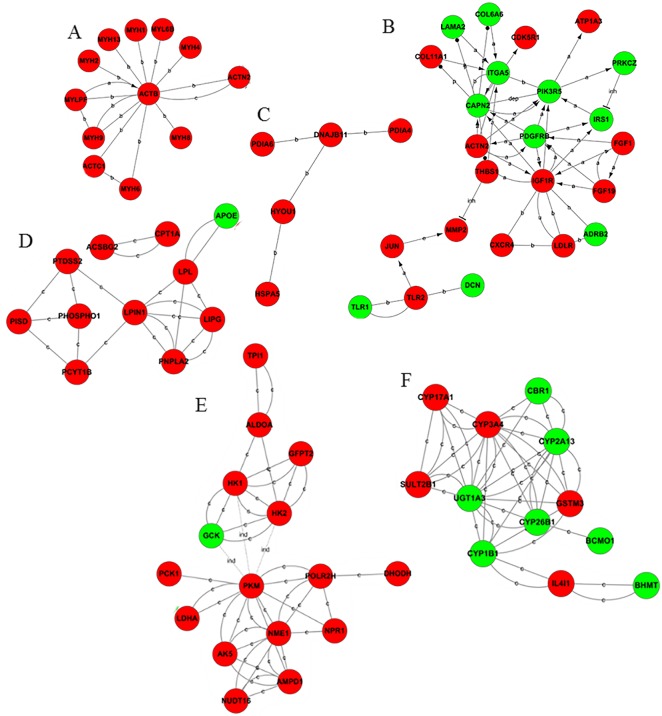
Fig 4. Gene act subnetworks in the 8 vs 16 psu categories.
(A): cytoskeleton; (B): PI3K signaling pathways; (C): endoplasmic reticulum activity; (D): lipid and glycerophospholipid metabolism; (E): carbohydrates and pyruvate metabolism; and (F): steroid hormone metabolism and oxidative stress. The red balls represent up-regulated genes, while the green balls represent down-regulated genes. The connections of genes were generated from the data analysis consist of GO analysis and KEGG pathway. The solid lines represent the relationships between the genes. The dashed lines represent the genes that have an indirect effect. The arrow represents activation. The flathead represents suppression. ‘a’ represents activation; ‘b’ represents binding; and ‘c’ represents compound. The abbreviation ‘dep’ represents phosphorylation; ‘dis’ represents dissociation; and ‘inh’ represents inhibition.

