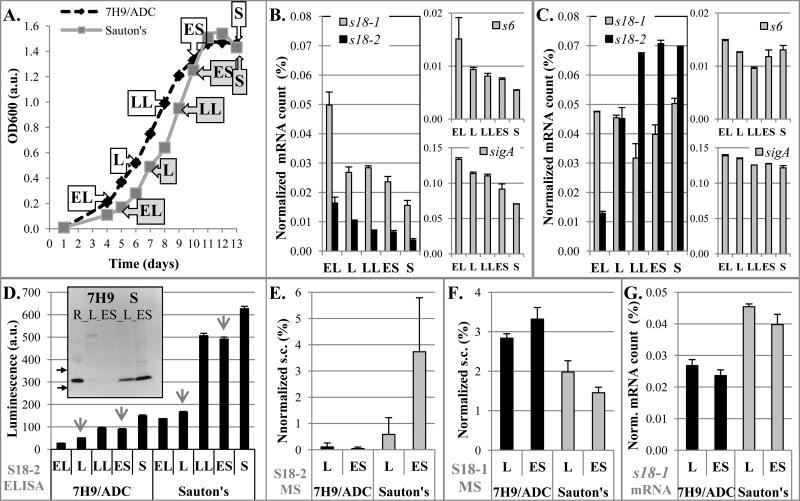
FIGURE 1. Expression of S18 mRNAs and proteins in M. tuberculosis H37Rv during growth in 7H9/ADC vs. Sauton's medium.
A. Growth curves of M. tuberculosis in indicated media. Aliquots were sampled for analysis at different growth stages as labeled (dashed black line for 7H9/ADC, grey solid line for Sauton's). Abbreviations for growth stages: EL-early logarithmic, L- logarithmic, LL-late logarithmic, ES-early stationary, and S-stationary phase.
B, C. Quantification of RNA: Quantitative real time (qRT)-PCR of specific mRNA for genes encoding S18-1, S18-2, S6 proteins, and sigA in M. tuberculosis grown in 7H9/ADC (B) or Sauton's medium (C), for samples obtained at time points as indicated in panel A. Normalized mRNA count corresponds to the number of specific mRNAs as percentage of 16S rRNA.
D. Quantification of S18-2 protein using ELISA: S18-2 was quantified in total protein extracts from samples indicated in panel A using polyclonal anti-S18-2 antibodies. Relative luminescence is fold change over the background signal. Samples selected for western blotting and qMS are indicated with arrows. Insert: Western blot with same antibodies. R-recombinant S18-2 protein control. Arrows show position of 10 kDa and 15 kDa MW markers.
E, F. Quantification by qMS of S18-2 (E) and S18-1 (F) proteins in selected samples: Samples that were analyzed by mass spectrometry are indicated by arrows in panel D. Spectral count (s.c.) of peptides for each protein was normalized against s.c. of all identified ribosomal proteins in the same sample. Of note, S18-1 and S18-2 proteins do not share any tryptic peptides and detection efficiency of specific peptides may not be the same, so that s.c. cannot be compared between two different proteins. Error bars are standard deviation from two independent samples.
G. Amount of s18-1 mRNA from the same samples is shown for the comparison with the panel C.
Error bars in all graphs are ±1 standard deviation of technical replicates, unless noted differently.

