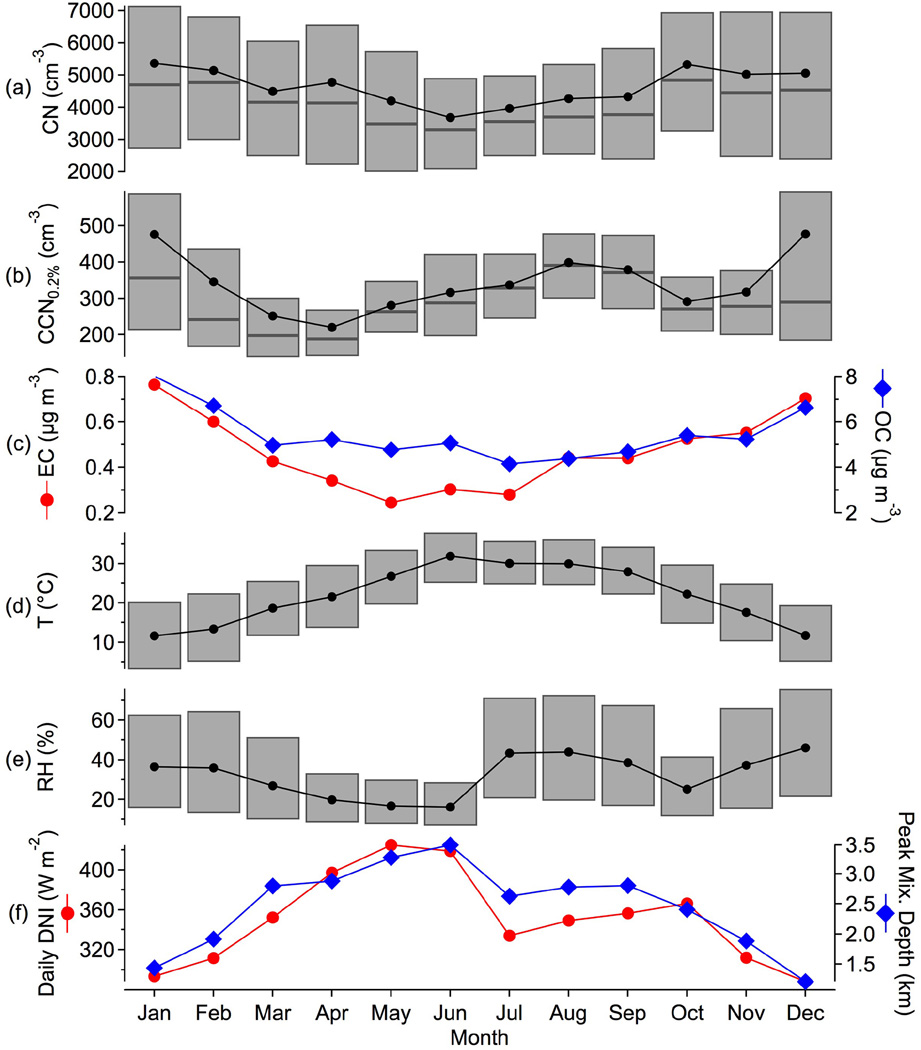
Figure 1.
Monthly statistics of (a) CN, (b) CCN (0.2 %), (c) OC and EC, (d) temperature, (e) RH and (f) direct normal irradiance (DNI). Circles, diamonds and the lines connecting them represent monthly averages. For (a) CN and (b) CCN, bars represent median and interquartile range of sub-monthly variability of the 1 h averaged data. For (d) temperature and (e) relative humidity, bars represent monthly extremes, as measured by 5 and 95 % levels of the 1 min average data. DNI is presented using 24 h averages so that it includes the effect of the changing length of day with season, and peak mixing depth is calculated using the 16:00 radiosonde data.

