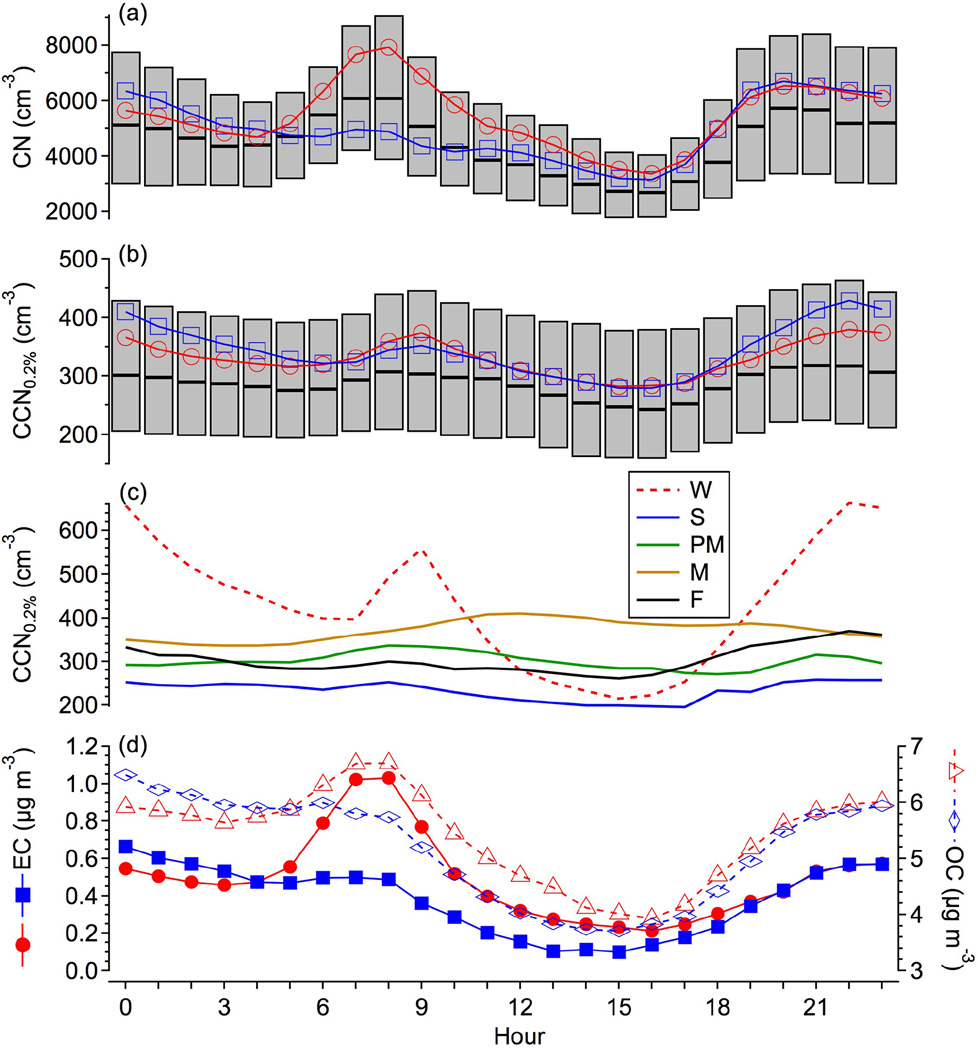
Figure 3.
Hourly trends of (a) CN and (b) CCN (0.2 %). Bars indicate median and interquartile range of the variability within each hour. Mean CN and CCN concentrations are shown for both weekdays (red) and weekends (blue). Hourly trends of CCN are shown in (c) for each season. Mean EC (solid) and OC (dashed) concentrations (d) are shown for weekdays (red) and weekends (blue).

