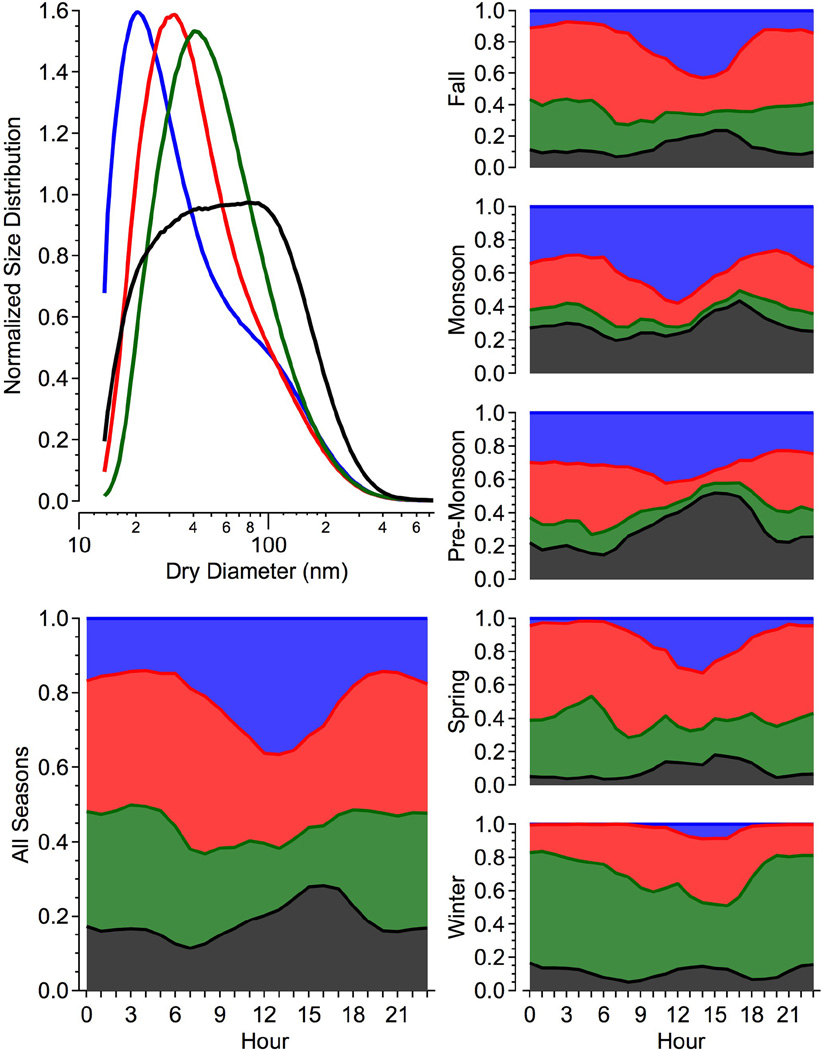
Figure 5.
Size distribution cluster centroids, as derived by the “K-means” algorithm, and the hourly distribution of cluster associations, separated by season. Clusters are assigned the following identifiers: nucleation (N; blue), fresh fossil (FF; red), winter/nocturnal (WN; green) and condensation/coagulation (CC; black).

