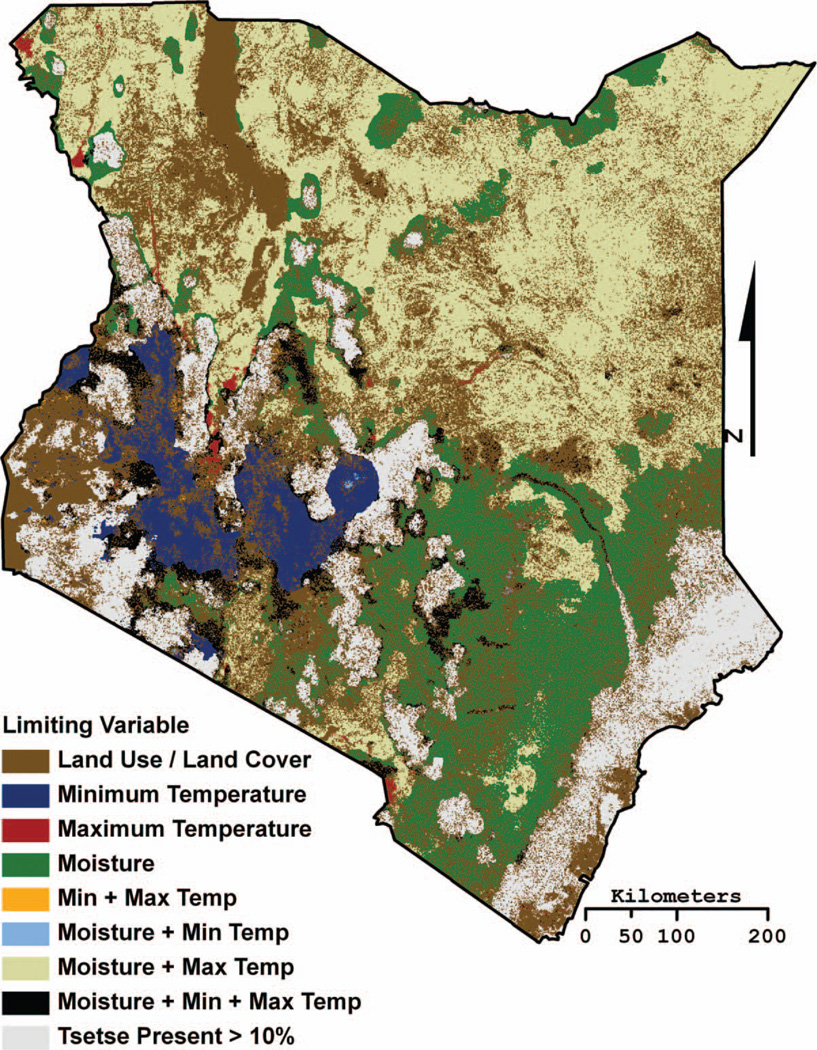
Figure 3.
The spatial location where an environmental variable (i.e., land cover, minimum temperature, maximum temperature, and moisture) limits tsetse distributions within the Tsetse Ecological Distribution (TED) model. Combination classes indicate locations where more than one variable limits tsetse distributions (e.g., moisture + maximum temperature predicted to be both too hot and too dry at some point in the year for tsetse distributions to persist). The tsetse present >10% class indicates the locations where the TED model percentage probability map predicts a greater than 10 percent probability of tsetse always being present. (Color figure available online.)

