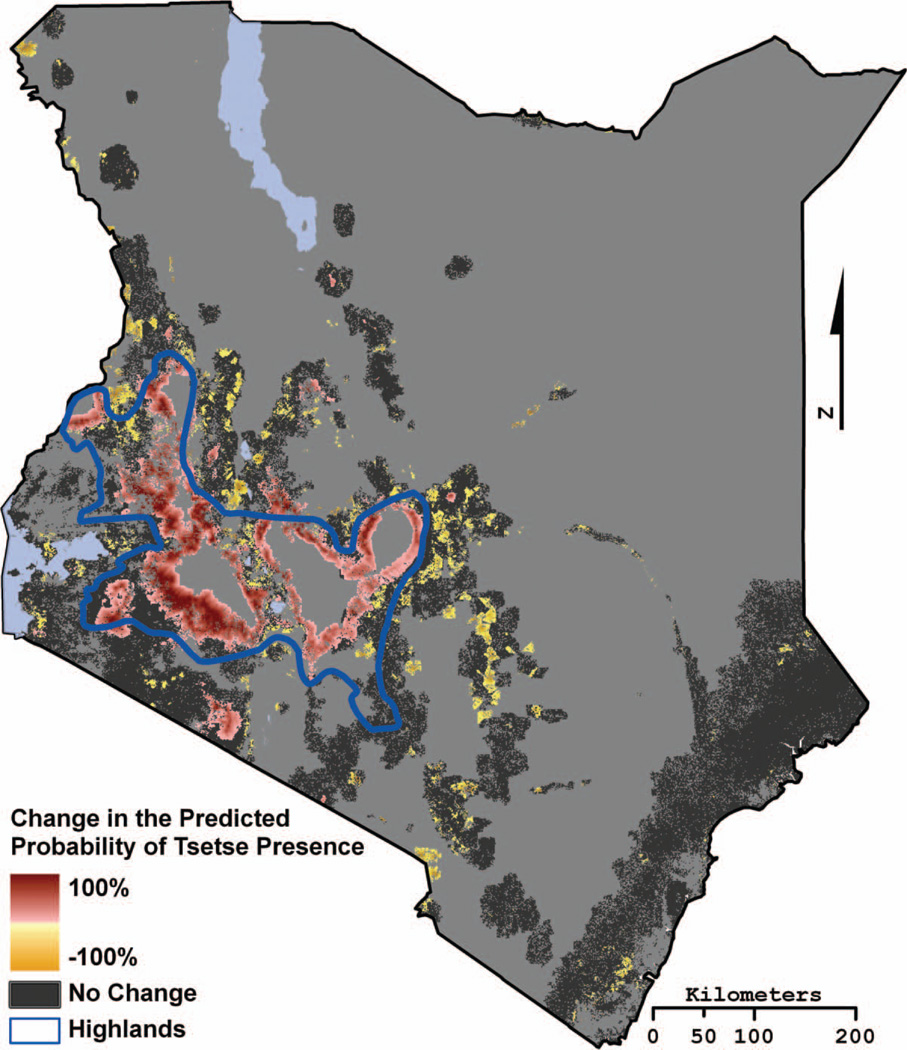
Figure 4.
The Tsetse Ecological Distribution (TED) model–projected change in the percentage probability of tsetse occurrence based on projected change in temperature from Regional Atmospheric Modeling System. An expansion of tsetse indicates a location where tsetse were not predicted in 2001–2009 but are projected by 2051–2059. A contraction in tsetse indicates a location where tsetse were predicted in 2001–2009 but not projected as present by 2051–2059. A positive value indicates a location where the probability of tsetse occurrence is projected to increase by the displayed percentage. Conversely, a negative value indicates a location where the probability of tsetse occurrence is projected to decrease by the displayed percentage. The region referred to as the Kenyan Highlands is outlined in blue. (Color figure available online.)

