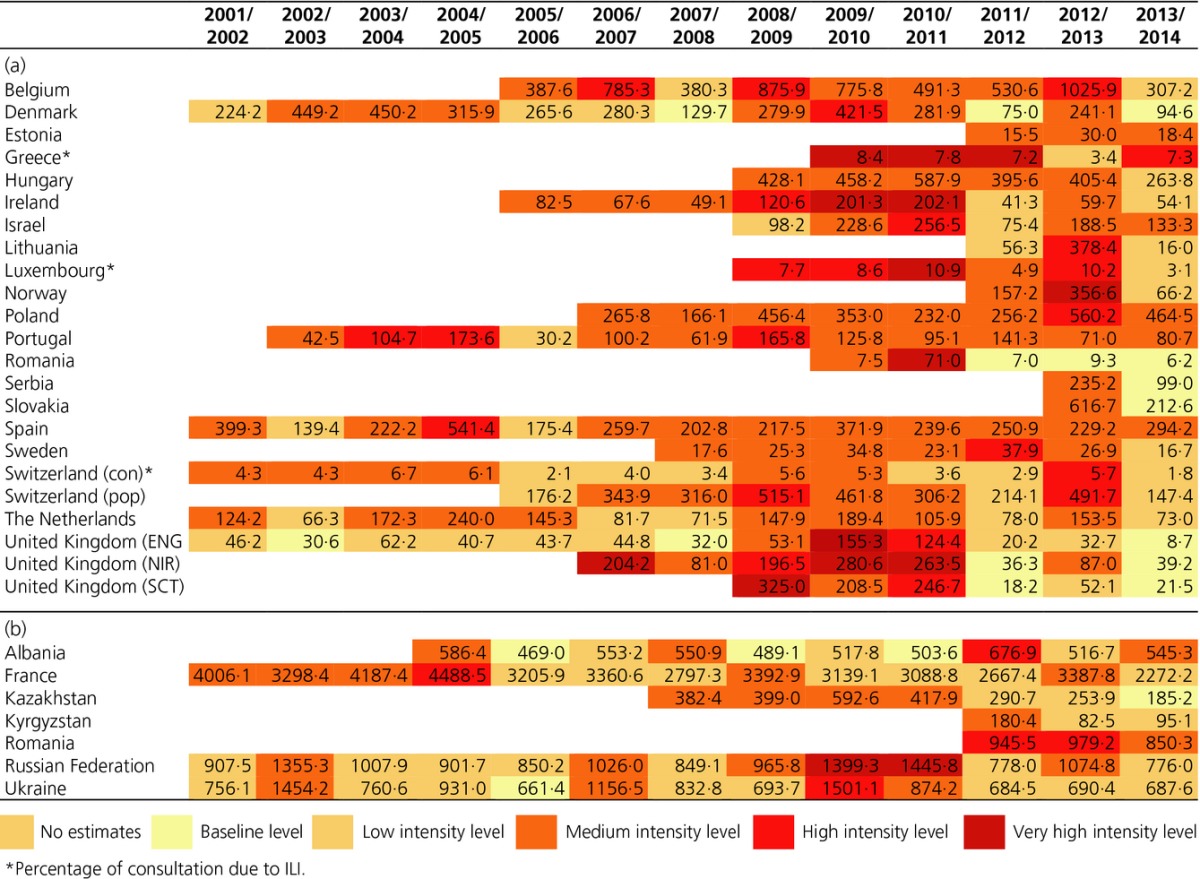
Table 3.
(a) Highest influenza-like illness (ILI) weekly consultation rate intensity by season and country (colors indicate the ILI intensity level corresponding to the highest rate in the season), 2001/2002 to 2013/2014. (b) Highest acute respiratory infections (ARI) weekly consultation rate intensity by season and country (colors indicate the ARI intensity level corresponding to the highest rate in the season), 2001/2002 to 2013/2014