
Figure 1.
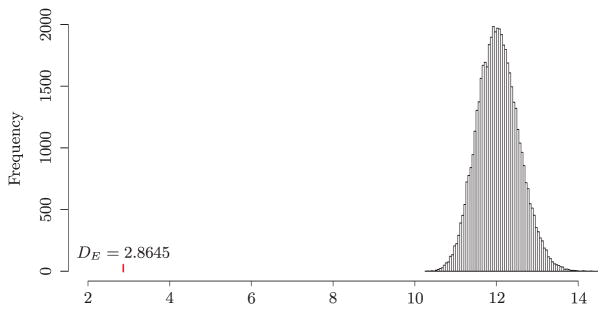
Analysis of breast cancer gene expression data: histogram of the sum of scaled differences between two Cox regression coefficients for 15,028 randomly selected gene pairs based on 50,000 permutations. The vertical bar represents the sum of scaled differences between two Cox regression coefficients for the 15,028 genes pairs on the KEGG network.