
Fig. 10.
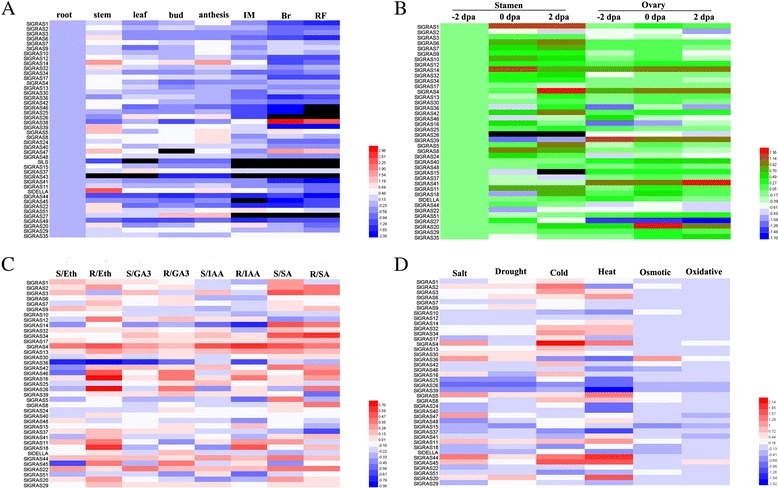
The expression profiles of SlGRAS genes visualized as heatmaps with respect to different tissues (a), floral organs (b), hormone treatments (c), and stress treatments (d). Members in the same subfamily based on the phylogenetic tree (Fig. 4) were grouped together. The color scale represents log10 expression values. The relative expression levels of root, -2 dpa stamen, and untreated control samples were normalized to 0