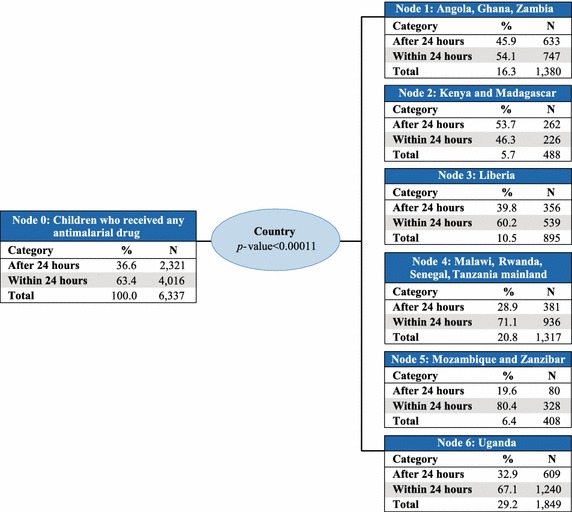
Fig. 2.

Prompt treatment with ACT among children under five treated with any anti-malarial medicine—Chi square automatic interaction detector tree diagram, level 1. N number of children. The total line of each box represents the share of the total number of children who received any anti-malarial treatment
