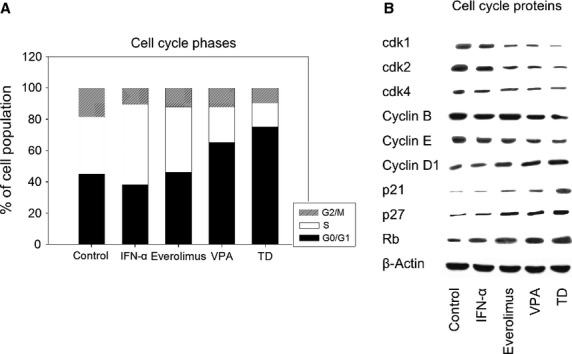
Figure 2.

(A) Cell cycle analysis of PC-3 cells. Tumour cells were treated either with 100 U/ml IFNα, 1 nM everolimus or 1 mM VPA, or with all compounds simultaneously (TD). Controls remained untreated. Cell cycle analysis was carried out after 24 hrs. The cell population at each checkpoint is expressed as percentage of total analysed cells. One representative experiment of three is shown. (B) Western blot of cell cycle proteins. PC-3 cells were treated either with 100 U/ml IFNα, 1 nM everolimus or 1 mM VPA, or with all compounds simultaneously (TD). Controls remained untreated. β-actin served as the internal control. The figure shows one representative from three separate experiments.
