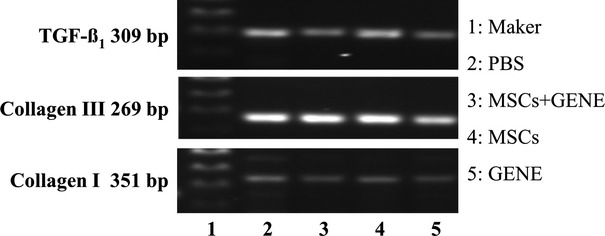
Figure 6.

Representative RT-PCR electrophoresis gel (1: Maker; 2: PBS group; 3: MSCs+ GENE group; 4: MSCs group; 5: GENE group). Note that myocardial mRNA expression of TGF-β1 and collagen I were decreased in GENE and MSCs+GENE groups compared to PBS group, mRNA expression of collagen III was increased in MSCs group while decreased in GENE group. Collagen I/III ratio was reduced in MSCs and GENE groups and in MSCs+ GENE group.
