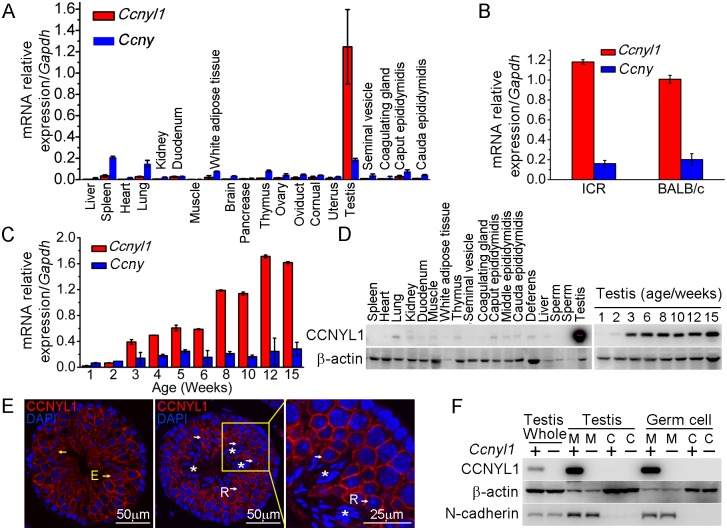
Fig 1. The expression pattern of CCNYL1 in mice.
(A) Ccnyl1 and Ccny mRNA levels were measured in different tissues of adult WT mice (n = 4). (B) Ccnyl1 and Ccny mRNA levels were measured in testes of ICR and BABL/c mouse lines (n = 4 per group). (C) Both Ccnyl1 and Ccny mRNA levels were measured in testes of WT mice of different age (n = 4). (D) CCNYL1 protein levels were measured in different tissues of adult WT mice, and in testes of WT mice of different ages. β-actin served as the protein loading control. (E) Immunolabeling of CCNYL1 (red) during the spermatogenic cycle of testicular sections. Nuclei were labeled with DAPI (blue). R: round spermatids (white arrows); E: elongated spermatids (yellow arrows); spermatozoa with shed residual bodies (asterisks). Scale bar for left and middle panels: 50 μm, scale bar for right panel: 25 μm. (F) CCNYL1 protein expression was measured in membrane extracts (designated as M) and cytoplasmic extracts (designated as C) isolated from testicular or germ cells of WT and Ccnyl1-/- mice. N-cadherin served as the membrane protein-loading control, whereas β-actin served as the cytoplasmic protein loading control. Data in bar graphs are presented as mean ± SEM.

