
Fig 1. Non-homoplasmic mutation frequency in the whole mtDNA.
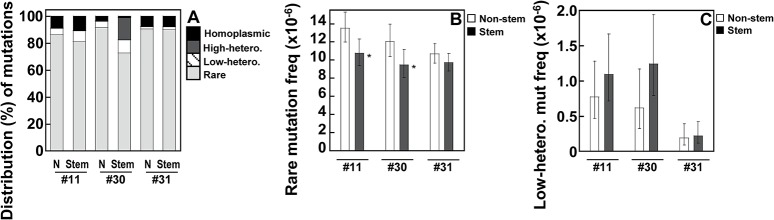
Point mutations in the whole mtDNA were determined using DS. Data are from human breast normal epithelial cells (non-stem (N) vs. stem) developed from women (ID #11, #30, and #31). (A-B) The cutoffs of mutation frequency (% clonality) used for rare, low-heteroplasmic, high-heteroplasmic, and homoplasmic mutations are: 0−0.5%, >0.5−20%, >20−<95%, and 95−100%, respectively. (A) The distribution (%) of rare, low-heteroplasmic, high-heteroplasmic, and homoplasmic mutations is calculated as numbers of corresponding specific-clonality range mutations per numbers of total (0–100% clonality) mutations. (B-C) Error bars represent the Wilson Score 95% confidence intervals. (B) Significant differences in rare mutation frequencies between non-stem and stem cells from two women (ID #11 and #30) are indicated (p <0.05 (*) by the 2-sample test for equality of proportions with continuity correction).