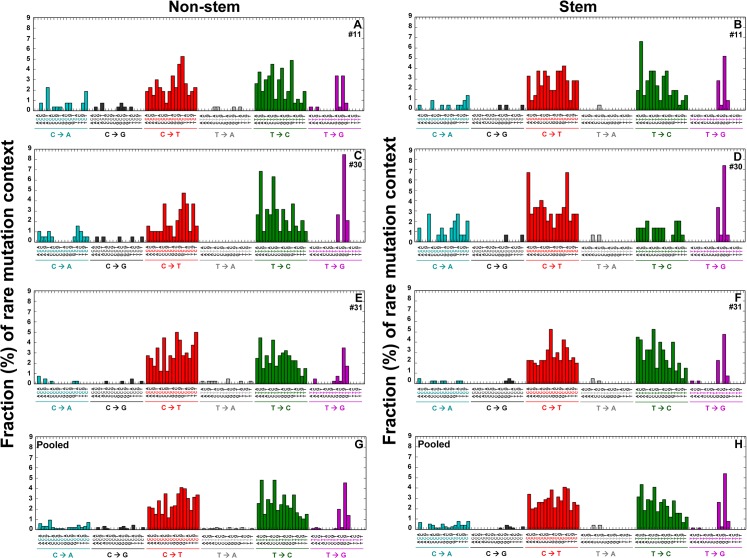
Fig 4. Genome sequence context spectra of rare mutations in the whole mtDNA.
Point mutations in the whole mtDNA were determined using DS. The bases immediately 5’ and 3’ to the mutation base (trinucleotides) are calculated as fractions (%) of each type of trinucleotide point mutations (vertical axis) and depict the contribution of each genome sequence context to each point mutation type. The 96 substitution classifications are displayed on the horizontal axes. The graphs list 96 mutation type contexts of one strand, however, the data also represent the complementary mutation context sequences. Data are from human breast normal epithelial cells (non-stem vs. stem) developed from women (ID #11, #30, and #31). Pooled data from all three women are shown in (G) and (H).

