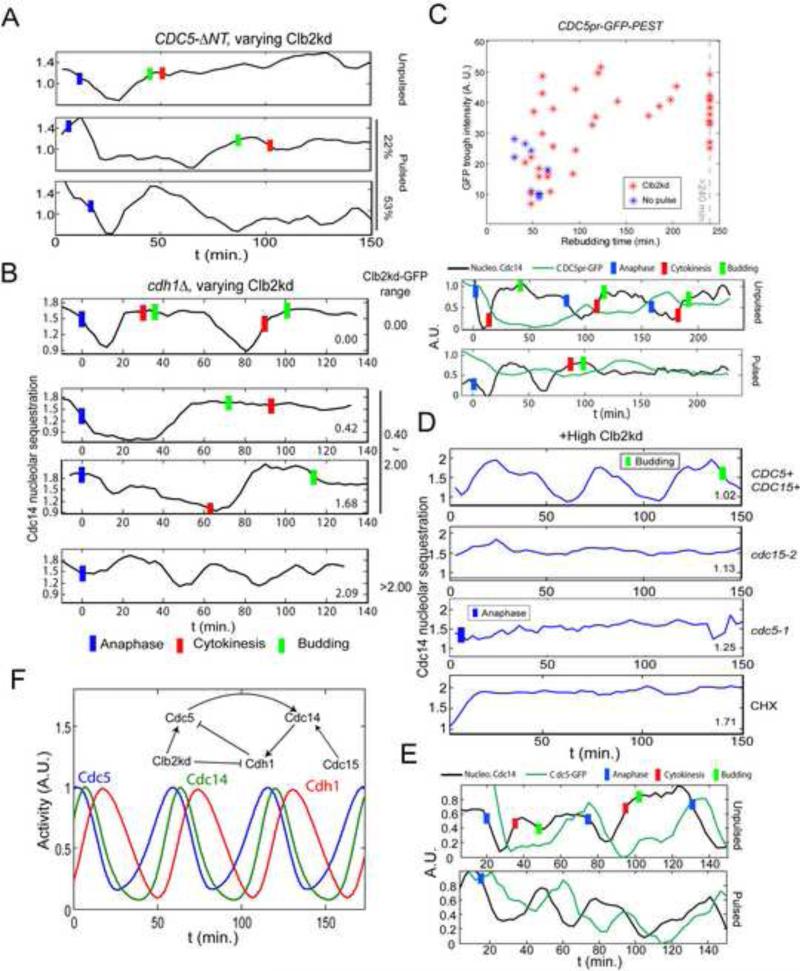
Figure 3. Requirements for Cdc14 endocycles.
A. As in Fig. 1B, but cells also cdc5::3XCDC5-ΔNT. Among cells whose rebudding was delayed for at least 25 minutes (implying >1X peak Clb2kd, Fig. S1B), 19/36 cells showed fast Cdc14 release and resequestration, followed by prolonged Cdc14 release. 8/36 showed only prolonged Cdc14 release. B. As in Fig. 1D, but also cdh1Δ; 30 min Clb2kd-GFP pulse; typical traces for the indicated Clb2kd-GFP ranges. Among cells with >1X peak Clb2kd-GFP (n=86), 41% showed a prolonged Cdc14 release period (middle two traces); 43% (cells with highest Clb2kd-GFP) showed release endocycles with a reduced amplitude (bottom trace); Blue bars: anaphase; Red bars: cytokinesis; Green bars: bud emergence. C. CDC5pr-GFP cells, as in Fig. 1B. Trough GFP intensities before rebudding plotted against rebudding times; rebudding delay indicates Clb2kd levels; sample traces below. D. Cells as in Fig. 1D, but also cdc15-2 or cdc5-1; after 35 min to allow initial Cdc14 release at permissive temperature, cells were plated for time-lapse at 37°C (restrictive temperature) (t=0). CHX: as above, except that time-lapse medium contained 0.2ng/μl cycloheximide (CHX). Among cells with >1X peak Clb2kd-GFP, 18/24 CDC15 CDC5 cells, 0/22 cdc15-2, 0/30 cdc5-1 and 3/64 cells in CHX exhibited Cdc14 release endocycles. Blue bars: anaphase; Green bars: bud emergence. E: As in Fig. 1B, but CDC5-GFP cells; 30 min Clb2kd pulsed; typical traces of Cdc14 release and Cdc5-GFP levels are shown. In 36/45 Cdc14-endocycling cells, Cdc5-GFP signal oscillated out-of-phase with Cdc14 release. F. ODE model simulating Cdc14-Cdh1-Cdc5 negative feedback (Supplemental Methods). See also figure S3.

