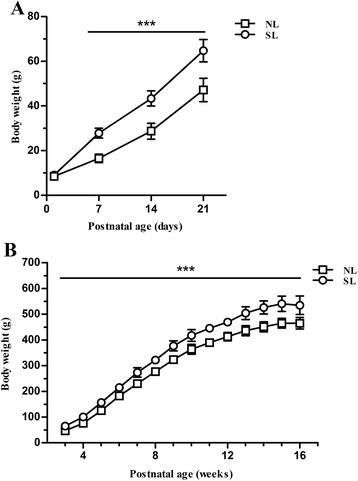
Fig. 1.

Body weights of rats during the first 16 weeks of life. Body weight growth curves are shown for rats from normal litters (NL, □) and small litters (SL, ○) during suckling period (a) (n = 24, 8 litters from each group) and postweaning period (b). (n = 10–12, 4 litters from each group) Results are expressed as mean ± standard error of mean (SEM). Age, litter size, and the interaction were significant, *** P < 0.001
