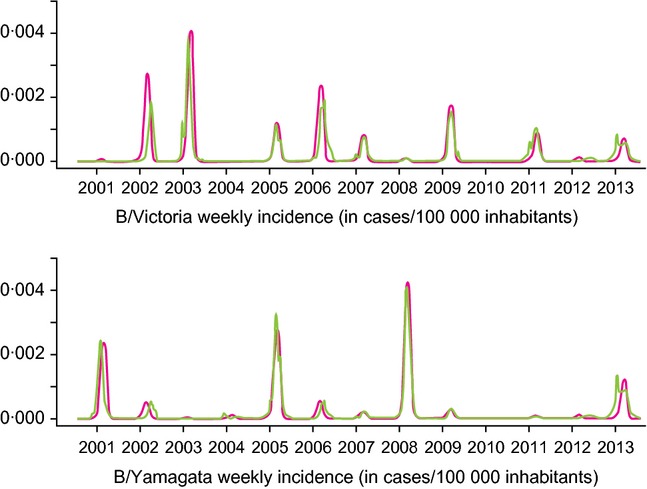
Figure 2.

Comparison of weekly influenza incidence for B/Victoria and B/Yamagata predicted by the model versus the weekly incidence observed over the period 2000–2013. Green lines indicate the observed incidence and pink lines indicate the predicted incidence.
