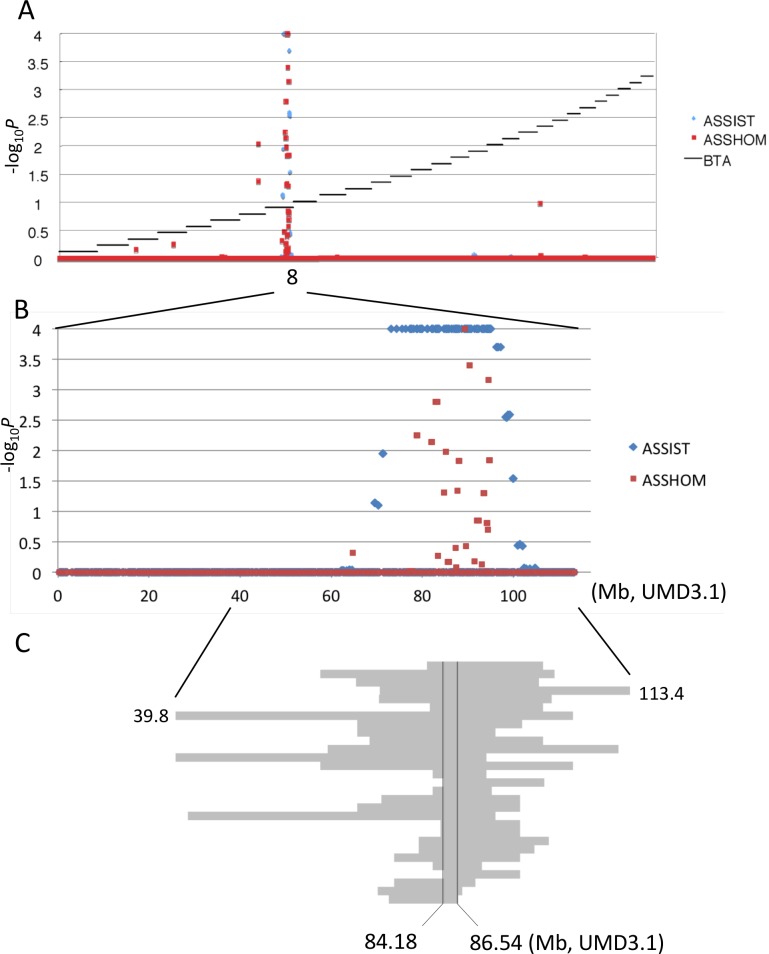
Fig 4. Mapping of homozygosity and autozygosity for skeletal dysplasia.
(A) The results of the genome-wide homozygosity and autozygosity mapping of skeletal dysplasia using 14 affected and 34 normal animals from three families. Black horizontal bars mark the limits between the 29 autosomes. ASSHOM and ASSIST were used for mapping [14]. (B) BTA8 (C) Schematic representation of homozygous regions on BTA8 in 29 affected animals.

