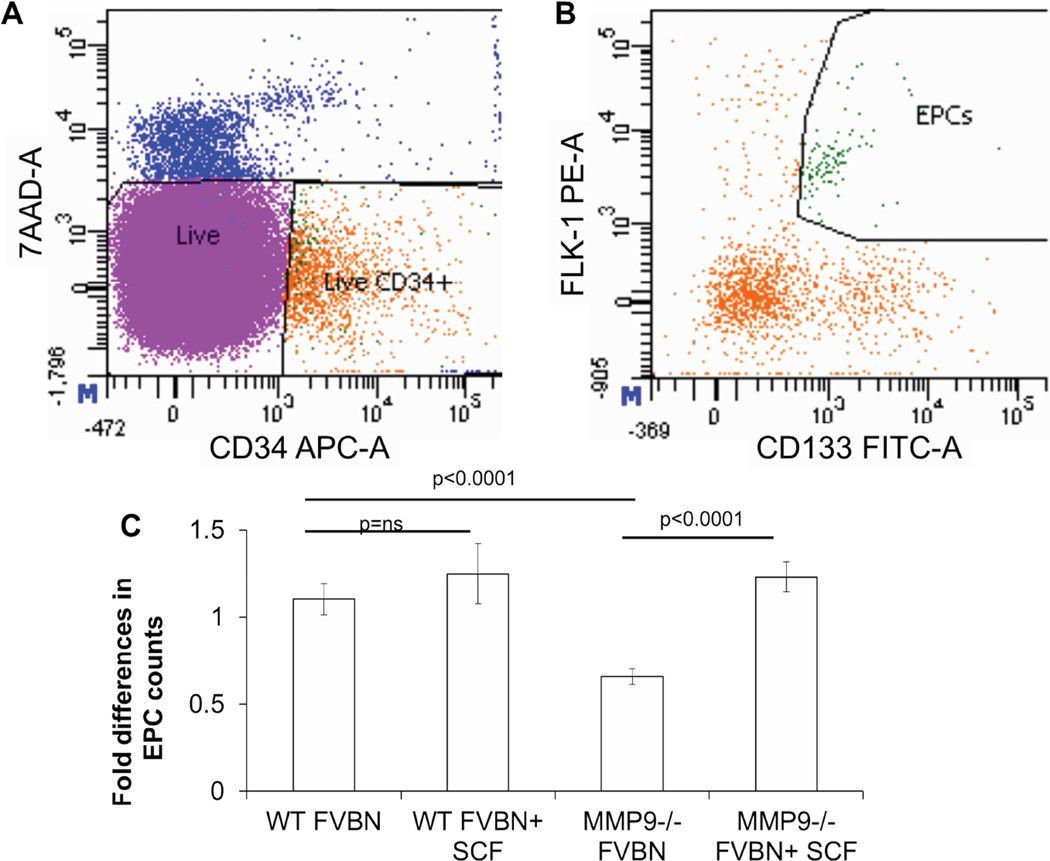
Figure 5.
At 3 days post wounding, peripheral blood was collected from all experimental and controls groups. Circulating levels of EPCs were quantified by counting CD34+CD133+Flk1+ cells using flow cytometry analysis. Representative dot plot distributions are shown where cells are first gated on live CD34+ cells (A). Within this population, EPCs are quantified as cells that express both Flk-1 and CD133 (B). (C) Quantitative analysis demonstrated that after cutaneous wounding MMP-9 −/− mice have a decreased (2-fold) EPC mobilization compared to wildtype FVBN control mice. Stem cell factor (SCF) treatment rescued this phenotype and increased EPC mobilization in MMP-9 −/− mice to levels similar in controls. SCF had no effect on FVBN controls. Bar plots represent mean±SEM, (n=3), p values by ANOVA.

