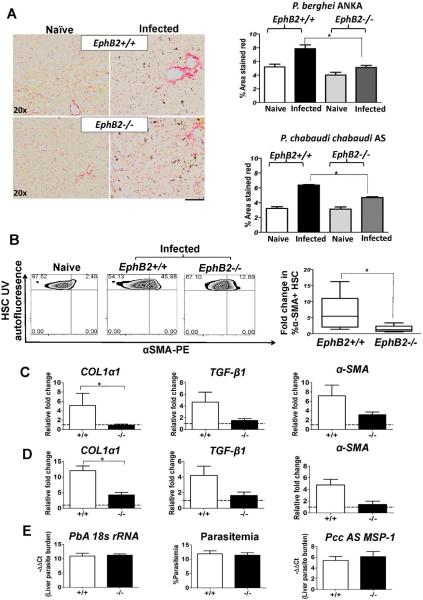
Figure 3. EphB2−/− mice are protected from liver fibrosis in rodent malaria infection.
C57BL/6 mice were infected with 106 PbA iRBCs or 105 Pcc iRBCs with 5 mice per group. As controls for infection, 2 mice were injected with Kreb's saline solution. (A) Picrosirius staining of the liver sections was used to detect collagen deposition in the liver at day 6 post PbA infection or day 12 post PccAS infection. (B) HSCs were identified according to the gating strategy outlined in Figure 6A and the production of α-SMA evaluated by flow cytometry. (C–D) RNA was extracted from the livers of PbA day 6 post-infection (C) or PccAS day 12 post-infection (D) and the level of profibrotic markers COL1a1, TGF-β1 and α-SMA mRNA measured by qPCR. (E) For liver parasites burden mRNA level of PbA 18s rRNA and PccAS MSP-1 measured by qPCR is shown as -ΔΔCt values. The % circulating parasitemia for PbA at day 6 post-infection is shown for comparison. The bars represent the cumulative data from 2 identical experiments and in total n=10 mice. The error bars represent ±SEM from the cumulative data of both experiments. * p<0.05; +/+=EphB2 WT; −/−=EphB2 KO.

