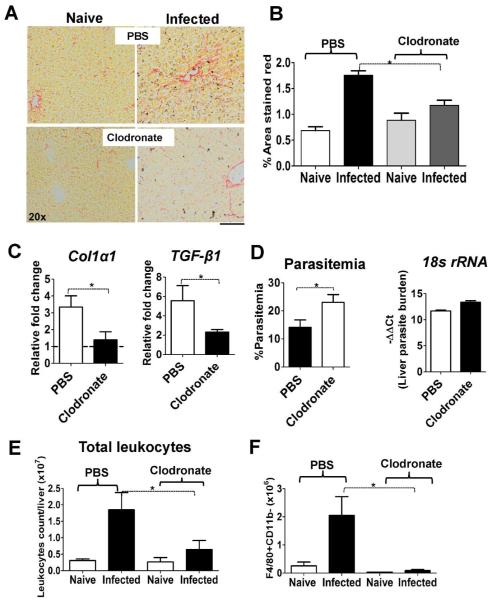
Figure 8. Collagen deposition in the liver of PbA-infected animals dependent on macrophages/Kupffer cells.
(A–B) Collagen deposition was measured by picrosirius staining of the liver sections at day 6 post PbA infection. Representative sections are shown in (A) and quantified using Image J software across 4 (naïve) or 8 (infected) individual animals per group pooled from 2 experiments (B). The bars represent the mean ±SEM. (C) At day 6 post-infection, RNA was extracted from the livers of PbA-infected mice and mRNA level of Col1a1 and TGF-β1 analyzed by qPCR. (D) For liver parasites burden, mRNA level of PbA 18s rRNA was measured by qPCR and is shown as -ΔΔCt values with the % circulating parasitemia at day 6 post-infection shown for comparison. Graphs represent the mean ± SEM from the cumulative data from 2 experiments. (E–F) The total number of leukocytes and Kupffer cells (gate 1, Figure 7) recruited in the liver on day 6 post-infection with PbA are shown. * p<0.05.

