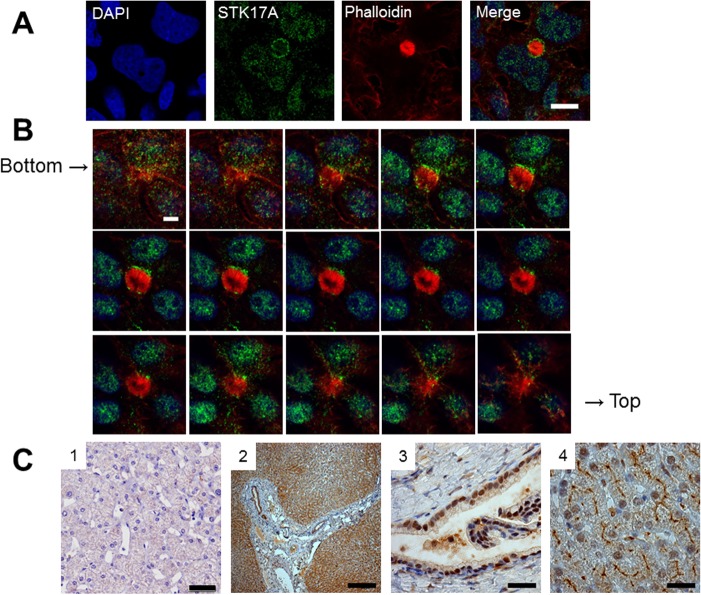
Fig 3. Bile canalicular localization of STK17A in HepG2 cells and human liver.
(A) HepG2 cells are stained with anti-STK17A antibody (green). DAPI (blue) and phalloidin (red) are used as counterstaining for nuclei and F-actin, respectively. Fluorescence images are captured using laser scanning confocal microscopy. The arrowhead shows STK17A surrounding bile canaliculi in HepG2 cells. Scale bar: 10 μm. (B) Z-stack series of bile canalicular STK17A in HepG2. Scale bar: 5 μm. (C) Formalin-fixed paraffin-embedded human liver section stained with anti-STK17A antibody. (1) Negative control. Scale bar: 20 μm. (2) Low-power view of STK17A staining at the porta hepatis and hepatic lobules. Scale bar: 250 μm. (3) At the porta hepatis, bile duct epithelial cells have positive signals in the nuclei but not in the apical side. Scale bar: 25 μm. (4) Hepatocyte nuclei and bile canaliculi are positive for STK17A in the hepatic lobules. Scale bar: 25 μm.

