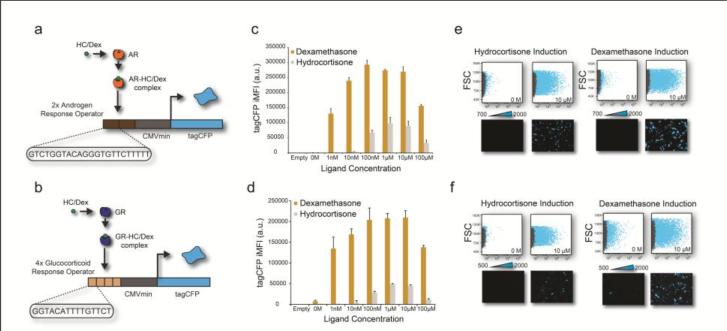
Figure 1. Hydrocortisone and dexamethasone titration of the AR and GR sensor.
(a) Genetic architecture of the AR fluorescent sensor. (b) Genetic architecture of the GR fluorescent sensor. (c) TagCFP iMFI of the AR sensor at different dexamethasone (yellow bars) and hydrocortisone (gray bars) concentrations. Error bars show standard deviation of a triplicate experiment. (d) TagCFP iMFI of the GR sensor at different dexamethasone (yellow bars) and hydrocortisone (gray bars) concentrations. Error bars show standard deviation of a triplicate experiment. (e) Flow cytometry scatter plots (forward scatter versus TagCFP) and fluorescence microscopy showing the low and high concentration of hydrocortisone (HC) and dexamethasone (Dex) on the AR sensor. The gray dots represent the untransfected (control) well, and the blue dots are the transfected cells. (f) Flow cytometry scatter plots (forward scatter versus TagCFP) and fluorescence microscopy showing the low and high concentration of hydrocortisone (HC) and dexamethasone (Dex) on the GR sensor. The gray dots represent the untransfected (control) well, and the blue dots are the transfected cells.

