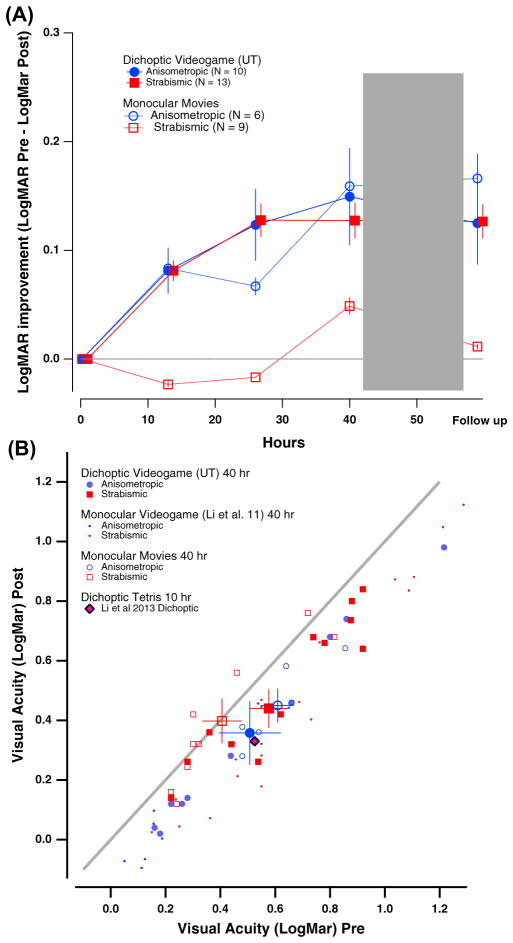
Fig. 3.
Changes in visual acuity (VA) as a function of hours of either video game play or movies watching. Color coding is used throughout the figures to represent the type of amblyopia. Red squares, strabismic (either pure strabismics or mixed etiology); blue circles, anisometropic. Solid symbols: game group; Open symbols: movies group. (A) Average VA (in logMAR units) as a function of hours of training for game (solid symbols) and movies (open symbols) groups. Error bars: one SEM (here and in all subsequent figures). (B) Post-intervention VA (y-axis) as a function of baseline VA (x-axis) for individual participants. Values below the diagonal represent improved VA at post-intervention relative to baseline. Larger colored symbols show averaged VA data for anisometropic (blue) and strabismic (red) individuals. Data from previous studies using either monocular videogame play (Li et al., 2011) or dichoptic tetris (Li et al., 2013) are shown for comparison.

