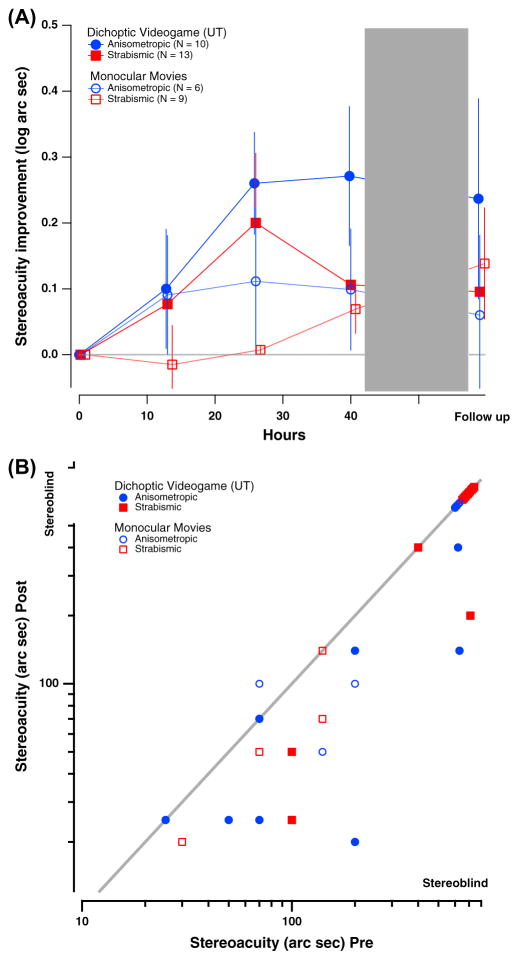
Fig. 4.
Changes in stereopsis as a function of hours of either video game play or movies watching. (A) Log stereoacuity improvement (Log stereoacuity Pre – Log stereoacuity Post) as a function of time in intervention (hours) for both game (solid symbols) and movies (open symbols) groups. The dotted gray line indicates no improvement. (B) Individual stereoacuity data at post-intervention as a function of baseline stereoacuity for game (solid symbols) and movies (open symbols) groups, plotted in log–log coordinates. Stereoacuity of 20–40 arcsec is within the normal stereo vision range; stereoacuity larger than 400 arcsec on the Randot circles test is considered stereo-blindness and was assigned a value of 600 arcsec. Color coding is similar to previous figures. Values below the diagonal represent improved stereoacuity. Note that not all individual data points are visible due to observations with overlapping values.

