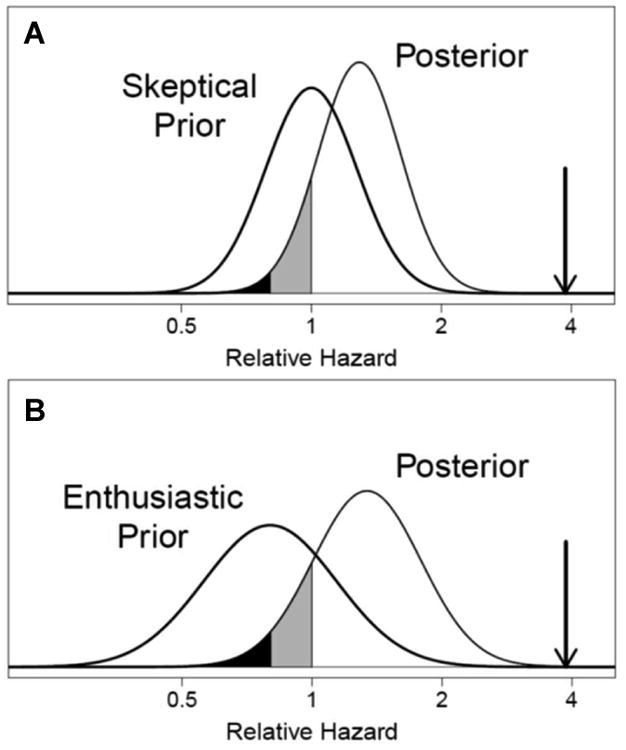
Figure 4.

Posterior distributions of the relative hazard comparing mortality during extended follow-up between the randomized frequent and conventional hemodialysis groups under prior distributions representing “conservative” (Panel A) and “enthusiastic” (Panel B) perspectives on the probability of a treatment benefit. The posterior distributions characterize the implications of the observed relative hazard of 3.88 (downward pointing arrow) for individuals with the perspectives indicated by the conservative and enthusiastic priors before seeing the results. The posterior probabilities of harm (unshaded), a small benefit with relative hazard between 0.8 and 1 (grey shading), and a substantial benefit with relative hazard ≤ 0.8 (black shading) are 0.88, 0.11, and 0.01, respectively, under the “conservative” prior, and are 0.85, 0.11, and 0.04, respectively, under the “enthusiastic” prior.
