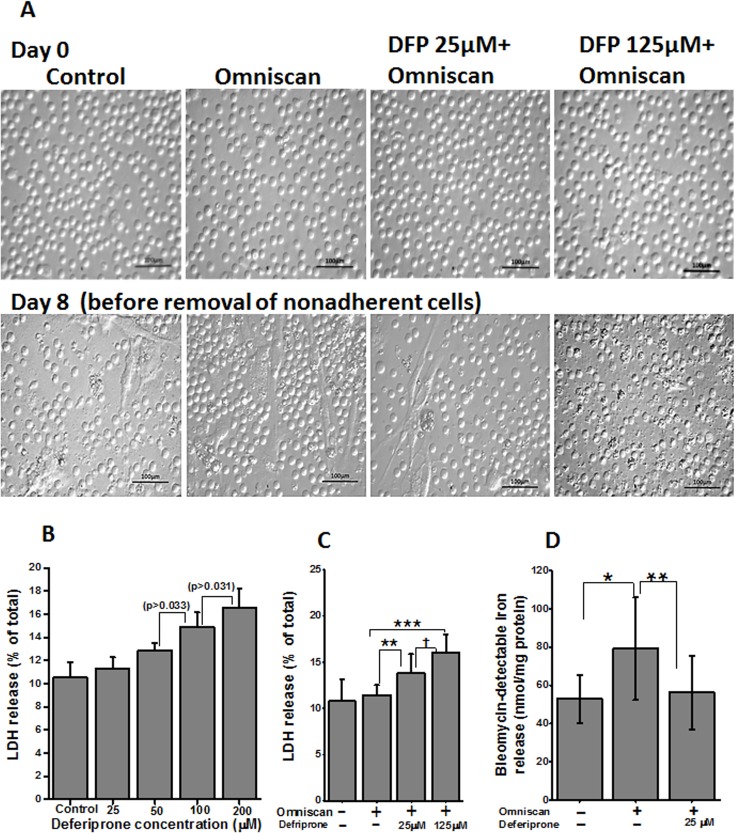
Fig 12. Effect of deferiprone on cell cytotoxicity.
(A) Light microscopic images on day 0 shows an equal number of PBMCs for each group. (B) LDH release by PBMC after treatment with deferiprone for 8 days. Adherent cells were lysed and supernatant media were collected from these cultures and analyzed for LDH release. The data presented shows no significant cytotoxicity on lower concentrations of deferiprone from control. LDH release was slightly increased on 100 and 200 μM concentrations of deferiprone, p > 0.033 and p > 0.031, respectively. Data points represent means ± SD of 3 separate studies. (C) LDH release by PBMC treated with 0.5 mmol of Omniscan and deferiprone together. PBMC were treated with Omniscan and deferiprone for 8 days. LDH release was measured as above. As shown in the histogram, both doses of deferiprone used (25μM and 125μM) showed significant LDH release (**p<0.01, ***p<0.001, respectively) when compared to untreated cells, but, as seen in the lower panels of light microscopic images of the treated cells, 25 μM deferiprone with Omniscan was not toxic to the cells. Images were taken before removing nonadherent and dead cells. A higher dose showed toxicity (†p<0.01) and it was confirmed with a Trypan blue exclusion test. Data presented here are from 3 separate studies. (D) Effect of deferiprone on Omniscan-induced catalytic iron release by PBMC. Deferiprone treatment decreases the release of catalytic iron of Omniscan-treated human PBMC, as shown by use of a bleomycin-detectable iron assay. At the end of the experiments, the cell culture supernatant was collected for the measurement of bleomycin-detectable iron. Values are means ±SD, n = 3, *p <0.05 compared with control, **p <0.01, deferiprone and Omniscan treated compared with Omniscan alone.

