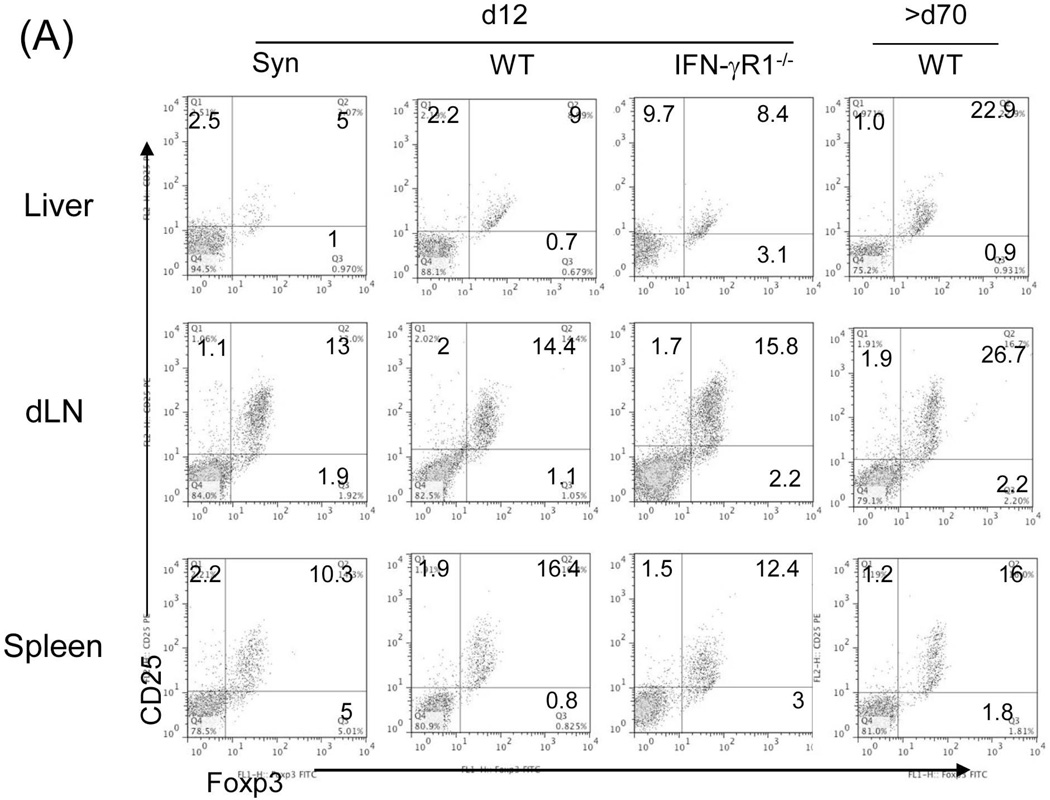
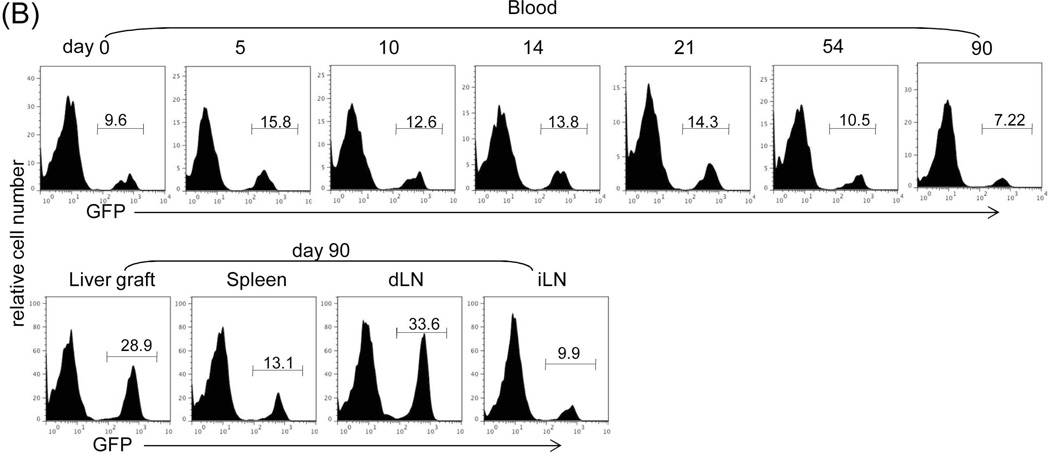
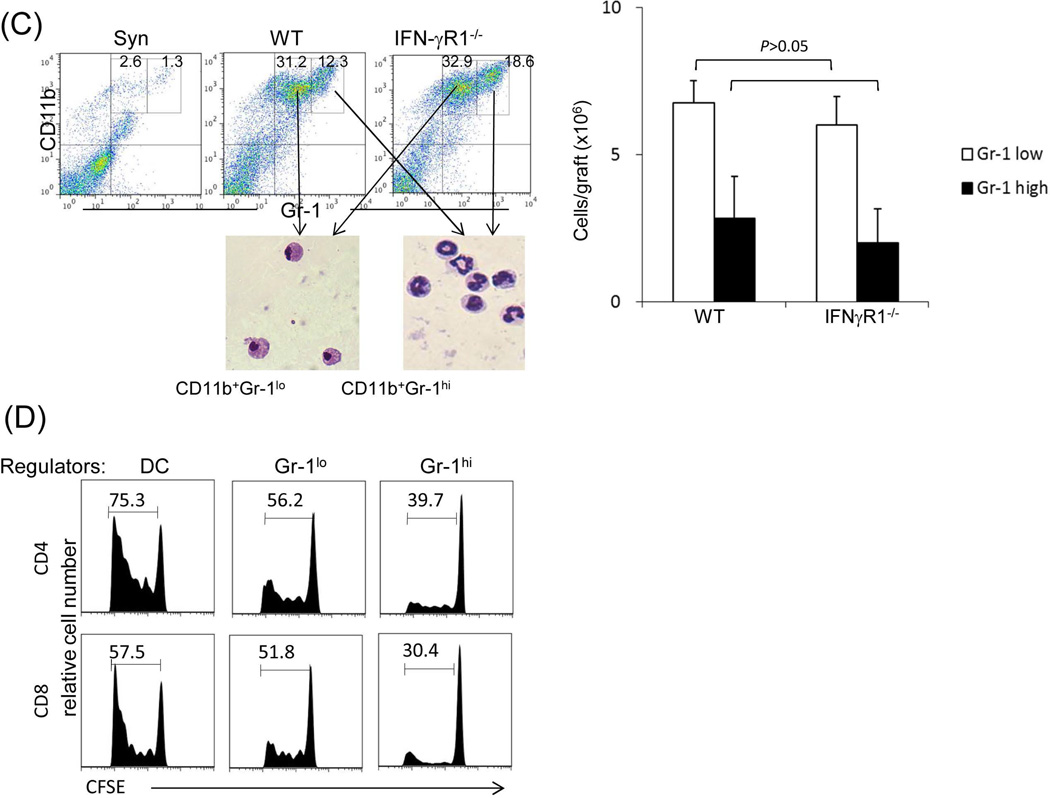
Figure 2. Impact of IFN-γ signaling on the generation of suppressor cells.
(A) Analysis of Treg cell activity. Lymphocytes isolated from liver graft, draining (d)-LN and spleen in recipients bearing WT or IFN-γR1−/− liver graft for 12 or >70 days (only available in WT group). B6 syngeneic transplantation (Syn) served as control. Cells were triple stained for CD4, CD25 and Foxp3 and analyzed by flow cytometry gated on CD4+ cells. The number is the percentage of positive cells, respectively. (B) Use of GFP-Foxp3 mice: WT BALB/c (H-2d) livers were transplanted into GFP-Foxp3 (H-2b) recipients. Blood was collected on POD 5, 10, 14, 21, 54 and >70 (upper panels). Recipients bearing long-term surviving liver grafts (90 days) were sacrificed and lymphocytes were isolated from liver graft, spleen, d-LN and irrelevant (i)-LN (lower panels). Cells were analyzed by flow cytometry for GFP fluorescence in CD4+ cells, and expressed as histograms. The number is the percentage of GFP positive cells in the CD4+ cell population. The data is representative of three separate experiments. (C) Analysis of myeloid suppressor cells in grafts. The leukocytes isolated from the liver graft on POD 12 were stained for CD11b and Gr-1 for flow analysis. The number is the percentage of CD11b+Gr-1high or Gr-1low cells. The numbers of CD11b+Gr-1low and CD11b+Gr-1high cells per graft were calculated based on flow analysis data and expressed as mean ± SD (n=3). CD11b+Gr-1low and CD11b+Gr-1high cells were sorted out for morphological (Giemsa staining) and the following functional studies. (D) T cell inhibitory activity: The CD11b+Gr-1low and CD11b+Gr-1high cells purified from liver allografts were used as regulators (use of DC as control for comparison), and added at the beginning into a one-way MLR culture where CFSE labeled C3H spleen T cells and B6 DC (at a ratio of 20:1) were used as responders and stimulators, respectively. The regulator: DC ratio was 1:1. An MLR culture without addition of the regulators (none) served as control. The proliferation of T cells was determined by CFSE dilution gated on CD4+ or CD8+ populations. The data is representative of three separate experiments.


