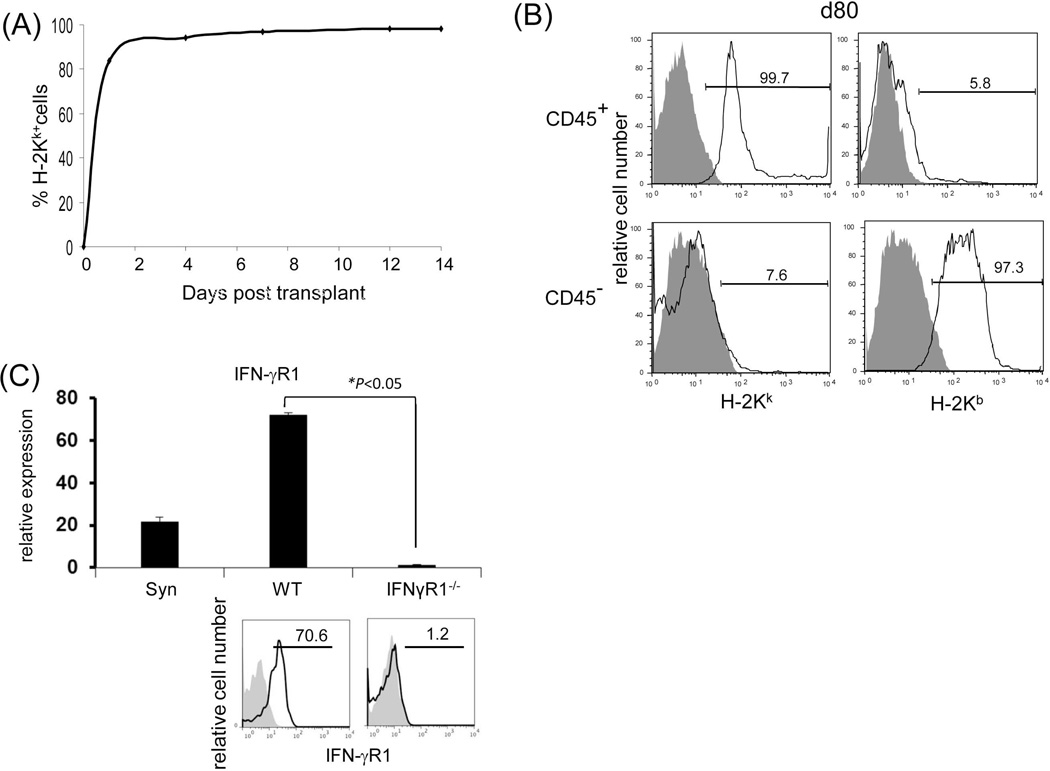
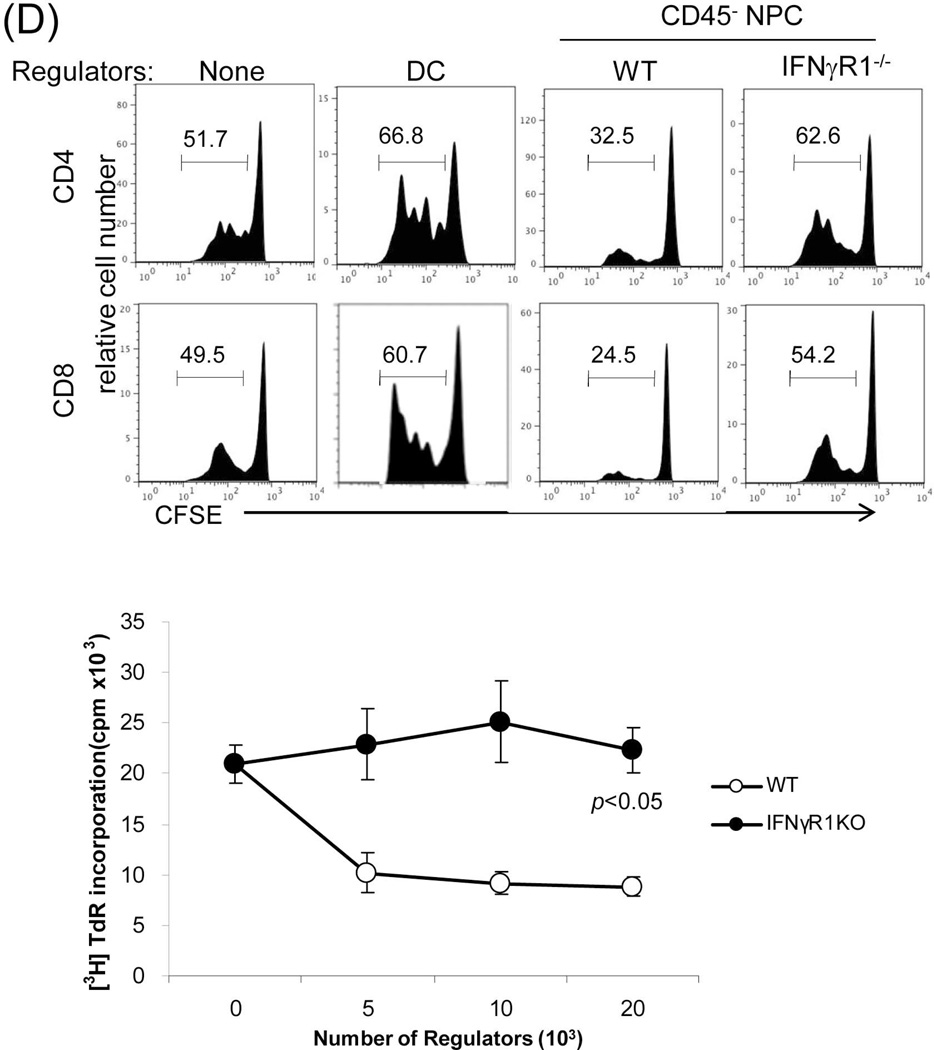
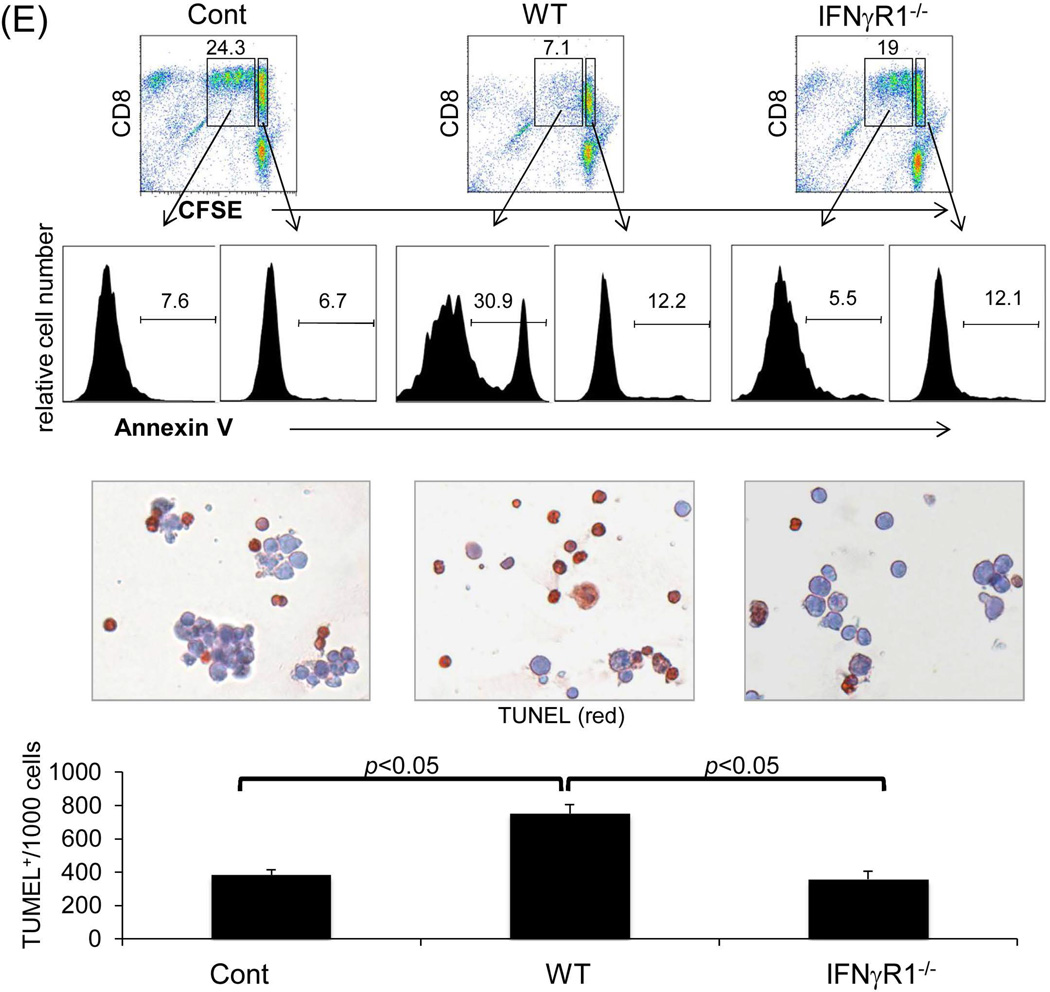
Figure 3. Graft non-hematopoietic NPC regulate immune response through IFN-γ signaling.
(A) Graft hematopoietic NPC promptly became of recipient origin. Liver NPC were isolated at various time points following transplantation of B6 (H-2b) livers into C3H (H-2k) recipients (syngeneic transplantation served as control). They were stained for CD45, donor (H-2Kb) and recipient (H-2Kk) MHC class I, and analyzed by flow cytometry. The data was expressed as percentage of H-2Kk+ cells in CD45+population. (B) Graft non-hematopoietic NPC remain of graft origin. NPC isolated from long-term surviving liver grafts were analyzed by flow cytometry for CD45, H-2Kb and H-2Kk, and expressed as histograms. Shaded area is isotype control. The number is the percentage of positive cells in the CD45+ or CD45− populations, respectively. The data are representative of three separate experiments. (C) Expression of IFN-γR1 on graft non-hematopoietic NPC. CD45− NPC purified from liver grafts (POD 12) were tested for expression of IFN-γR1 in mRNA (q-PCR) (upper panel, n=3) and protein levels (flow cytometry, lower panels). The number is the percentage of IFN-γR1 positive cells in the CD45− cell population. (D) Graft non-hematopoietic cell-mediated T cell inhibition is dependent on intact IFN-γ signaling. CFSE labeled C3H spleen T cells were cultured with B6 DC at a ratio of 20:1 for 3 days. CD45− cells from WT or IFN-γR1−/− liver allografts (use of DC as regulators for comparison) were added at the beginning into the culture at a regulator: DC ratio of 1:1. A MLR culture without addition of the regulator cells (none) served as control. The proliferation of T cells was determined by CFSE dilution gated on CD4+ or CD8+ populations (the number is the percentage of dividing cells, upper panels) or by thymidine uptake (n=3, lower panel). (E) Graft CD45− NPC induce T effector cell apoptosis via IFN-γ pathway in vitro. CFSE-labeled H2b specific CD8+ T cells from DES TCR transgenic mice (H2k) were cultured with B6 DC at a ratio of 20:1 for 3 days. CD45− NPC isolated from WT or IFN-γR1−/− liver allograft were added at the beginning into the culture at a DC:NPC=1:1. Addition of same number of B6 DC served as control (Cont). The cells were double stained with anti-CD8 and -annexin V mAbs, and analyzed by flow cytometry for the proliferation of specific T cells (CFSE dilution) gated on CD8+ population (upper panels). The number is percentage of dividing cells. Expression of annexin V was analyzed on dividing or non-diving CD8+ cells. Cell suspensions were stained with TUNEL and examined under a microscope. The number is percentage of annexin V+ cells in CD8+ cells. The cell suspensions were also stained with TUNEL (red) and examined under microscope, and counted, expressing as mean TUNEL+ cell number (in 1000 counted cells) ± SD. The data are representative of two separated experiments.


