
Fig 8. iNOS and Arg-1 expression in T. cruzi infected cardiac tissue of EP-2+/+ and EP-2-/- mice.
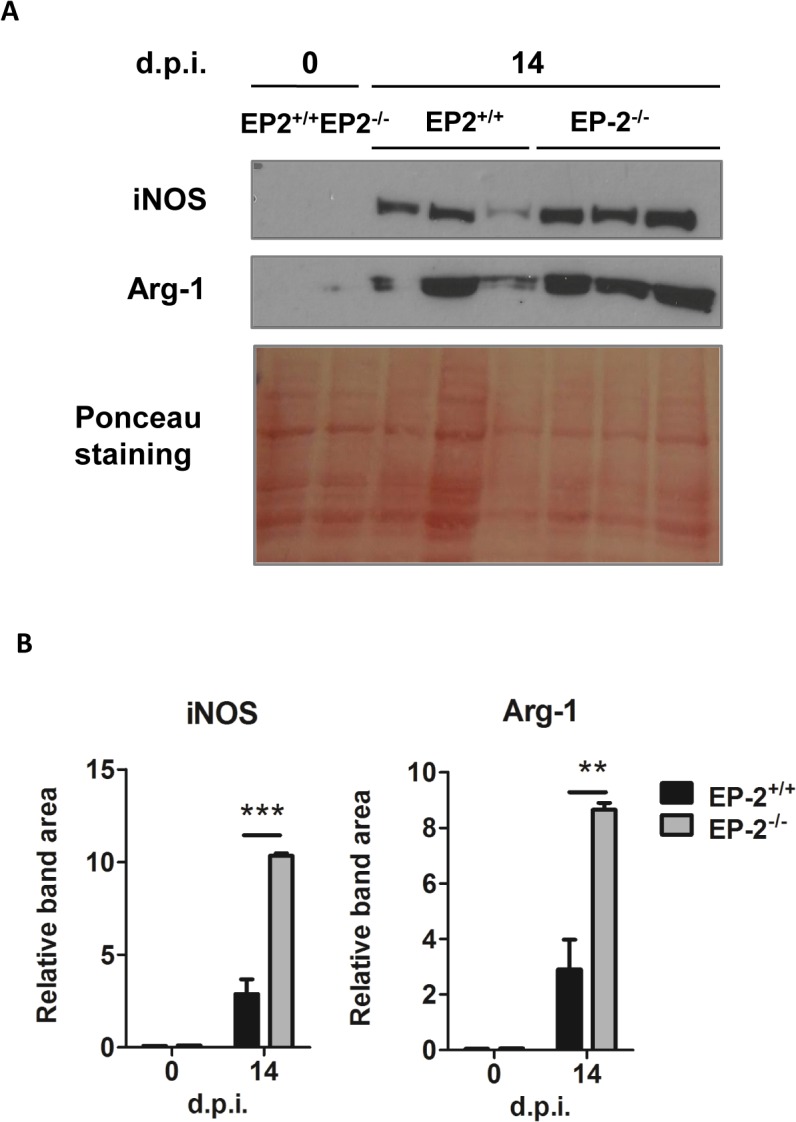
(A) Western blot analysis of iNOS and Arg-1 protein in extracts from hearts of EP-2+/+ and EP-2-/- non-infected mice (0 d.p.i.) and at 14 d.p.i. Ponceau staining of the blot is shown as a loading control. Extracts from 3 different infected mice were loaded. (B) Quantification of iNOS and Arg-1 band areas relative to the Ponceau staining from EP-2+/+ (black bars) and EP-2-/- (gray bars) is represented as means ± SEM in arbitrary units. A representative experiment out of two is shown (**p<0.01; ***p<0.001).