
Fig 2. Plotting the expression of seed genes and G64.
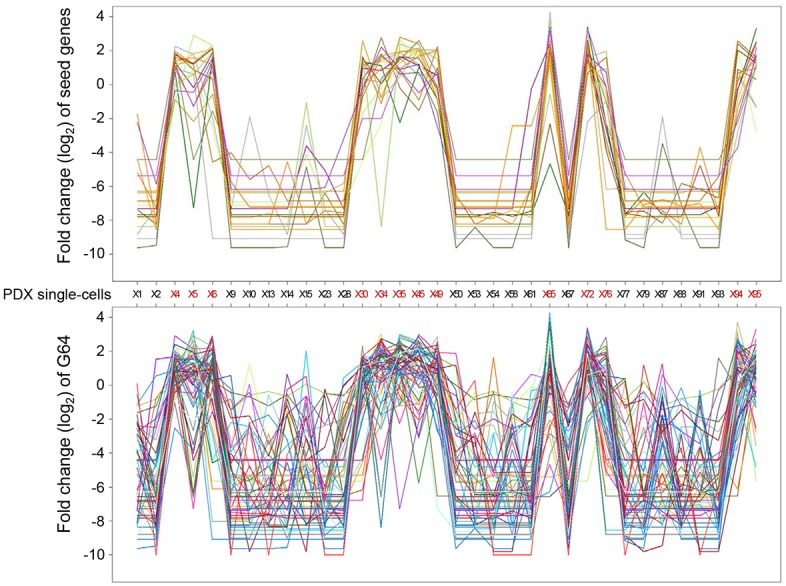
The log2 fold-change in the expression of a given gene among the single cells compared to the average expression level of the given in the 34 single cells was plotted for seed genes (upper panel) and for the genes in G64 (lower panel). Lines of different color indicate anonymous, distinct genes included in G64.