
Fig 3. Heat map combined with the hierarchical clustering analysis of G64 expression in the 34 single cells.
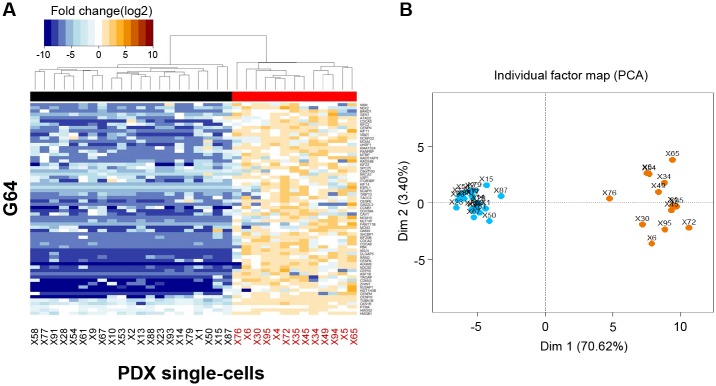
(A) The 34 single cells were clustered into two subgroups (i.e., single cells displaying G64 down-regulation [left] and single cells displaying G64 up-regulation [right]). See also the dendrogram and black and red flat bars at the top of the heat map. The single cells displaying G64 up-regulation are labeled ‘red’ at the bottom of the heat map to ensure that the single cells exhibiting up-regulated G64 expression could be compared with the single cells shown in the other figures. (B) Principal component analysis of G64 expression in the 34 single cells (see the Materials and Methods section). The same subgroups shown in (A) were clustered. Blue and orange dots represent single cells exhibiting G64 down- and up-regulation, respectively.