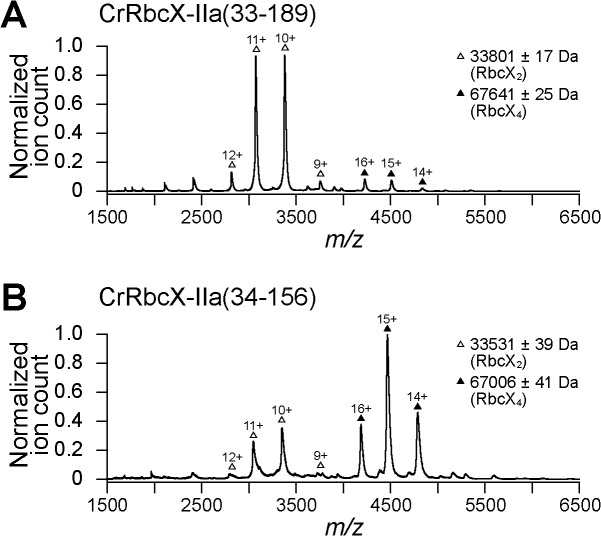
Fig 2. Oligomeric state of CrRbcX-IIa analyzed by native-MS.
Nano-ESI native-MS spectra of CrRbcX-IIa(33–189) (A) and CrRbcX-IIa(34–156) (B). Symbols indicate the charge state distributions with the charge states shown for some peaks; the calculated mass around the m/z values of the respective protein complexes is reported. The accuracy of mass values calculated from the different m/z peaks is indicated.

