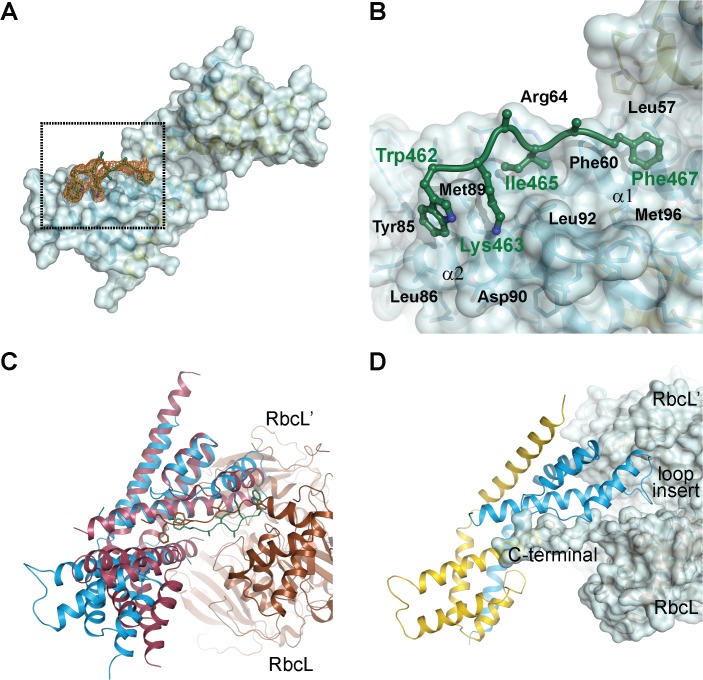
Fig 6. Crystal structure of a fusion protein revealing the interactions between CrRbcX-IIa and the C-terminal tail of CrRbcL.
(A) Unbiased omit difference electron density for the RbcL tail residues of the CrRbcL(462–474)-RbcX-IIa(37–156) fusion protein. The C-terminal sequence of CrRbcL is shown as a coil and the sidechains in stick representation. The difference electron density at 1.5 σ level is shown as orange meshwork. CrRbcX-IIa(37–156) is represented as a molecular surface. (B) Detailed view of the RbcL-RbcX interactions. The area boxed in panel (A) is shown. (C) Superposition of the CrRbcX-IIa(37–156) onto the Syn6301-RbcL8/AnaCA-RbcX8 crystal structure [10]. The structures are shown in ribbon representation. The RbcL subunits are shown in brown and siena; the AnaCA-RbcX dimer in red; CrRbcX-IIa dimer in blue. (D) Putative contacts of CrRbcX-IIa(37–156) with the surface of the Syn6301-RbcL8 complex. The same view as in panel (C) is shown.

