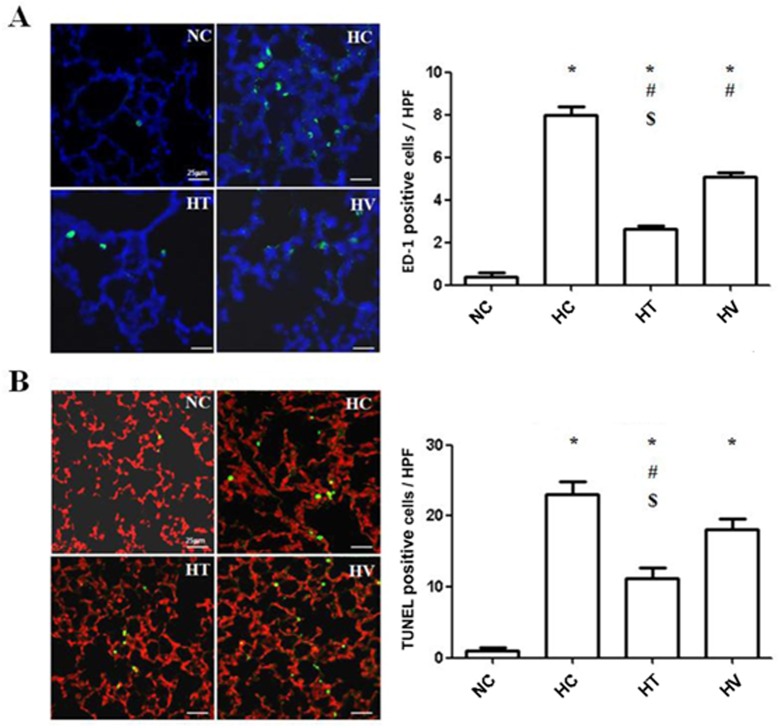
Fig 5. Analysis of ED-1-positive cells and apoptotic cells.
(A) Both HC and HV groups exhibited significantly more ED-1-positive cells than the HT group. ED-1 positive cells were labeled with FITC (green), and nuclei were labeled with DAPI (blue) (scale bars: 25 μm, × 400). (B) Apoptotic cells in the lungs of neonatal rats exposed to hyperoxic (90% oxygen) or normoxic conditions were identified by in situ TUNEL. Apoptotic cells were labeled with FITC (green), and nuclei were labeled with PI (red) (scale bars: 25 μm, × 400). The lungs of rat lungs exposed to hyperoxic conditions exhibited increased numbers of apoptotic cells compared to control rats. Less TUNEL-positive cells were detected in the HT group than in the HT and HV groups.* P < 0.05 vs. NC; # P < 0.05 vs. HC; $ P < 0.05 vs. HV. (n = 7 per group)

