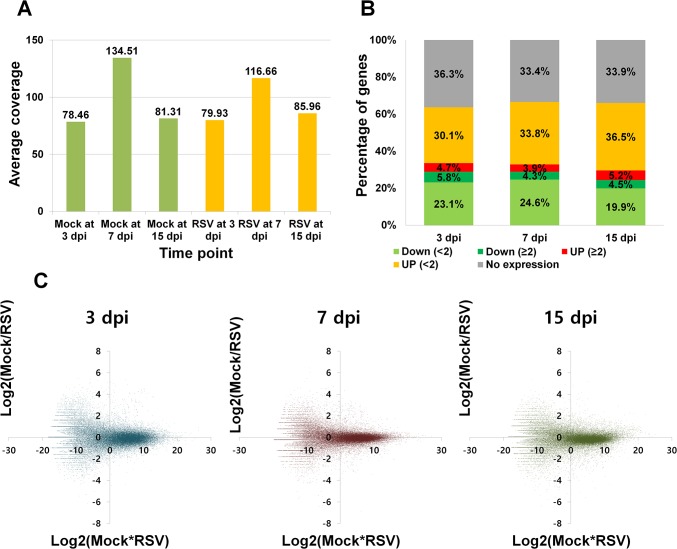
Fig 1. Summary of pair-end sequenced data and the number of expressed rice genes as determined by RNA-Seq for rice plants that were infected with RSV or not infected (mock).
Data were collected 3, 7, and 15 days post-infection (dpi). (A) The average coverage of pair-end sequenced RNA-Seq data obtained from each sample. Mock and RSV indicate rice plants that were exposed to non-viruliferous SBPH (green bars) and viruliferous SBPH (orange bars), respectively. (B) The distribution of fold-changes in expression at each time point by comparing RSV to Mock. Genes were divided into five groups: not expressed (gray), down-regulated with < 2-fold change (green); down-regulated with > 2- fold change (dark green); up-regulated with < 2-fold change (orange); and up-regulated with > 2-fold change (red). (C) Ratio versus intensity (R-I) scatter plot of RNA-Seq. X and Y axes represent log2-converted Mock*RSV and Mock/RSV values.

