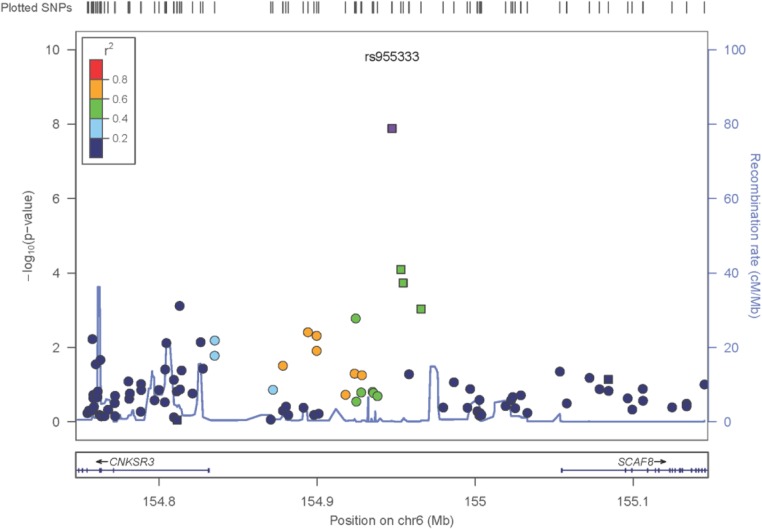
Fig 2. Zoom plot of the SCAF8 gene region (trans-ancestry meta-analysis across Discovery and Replication samples).
Squares denote SNPs in the Replication Study, Circles are SNPs that are only present in the GWAS, so the P-values shown reflect the GWAS Trans-Ancestry Meta-Analysis. The Ad-Mixed American population in 1000 Genomes was used for LD information.

