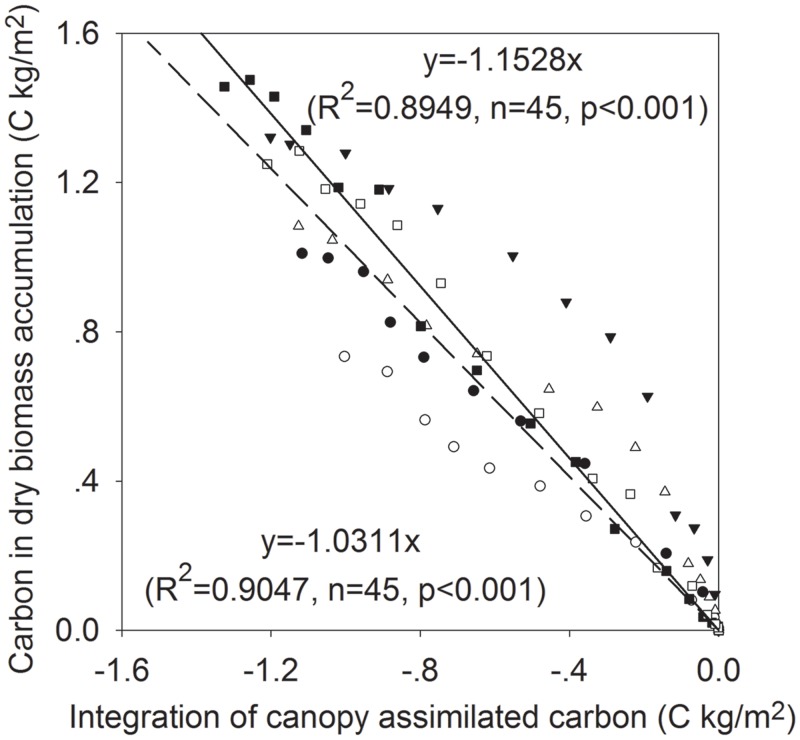
Fig 6. The relationships between dry biomass carbon and the sum of daily canopy assimilated carbon at different growing stages of 2011–2013.
Unfilled and filled symbols represent CK and MFR data, respectively; triangle, square and circle represent 2011, 2012, and 2013, respectively. Dashed and solid lines represent the fitted curves for CK and MFR data, respectively.

