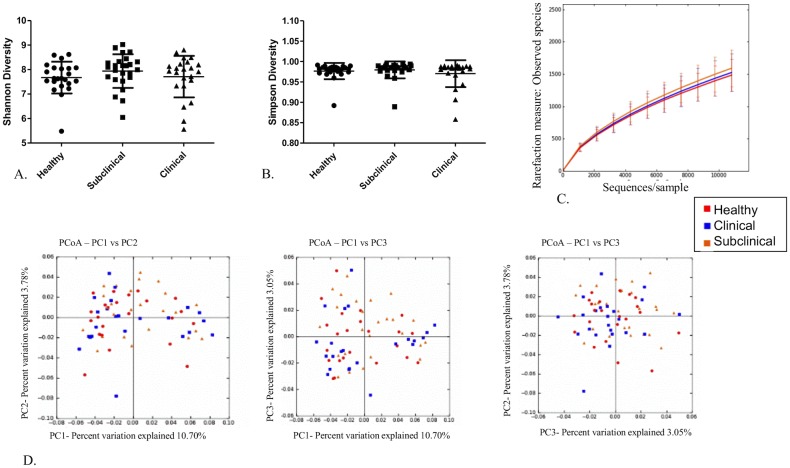
Fig 2. No differences in the fecal microbiota among the health groups at time 1.
A) Scatter dot plot of Shannon diversity index for all health groups; healthy (dots), subclinical (squares), and clinical (triangles) at time 1. Horizontal lines represent the mean for each group and error bars represent the standard deviation. There were no statistical differences among the groups. B) Scatter dot plot of Simpson diversity index for all health groups; healthy (dots), subclinical (squares), and clinical (triangles) at time 1. Horizontal lines represent the mean for each group and error bars represent the standard deviation. There were no statistical differences among the groups. C) Alpha rarefication curves for each of the health groups; healthy (red), clinical (blue), subclinical (orange) at time 1 showing numbers of observed species at each sampling depth on the y-axis and sequences/sample on the x-axis up to 10,800 sequences/sample. Error bars represent standard deviations of each group at the specified sampling depth. D) Principal coordinate analysis of unweighted Unifrac distance metric for all heath groups; healthy (red), clinical (blue), subclinical (orange) at time 1. There were no differences among the groups.

