
Fig. 8.
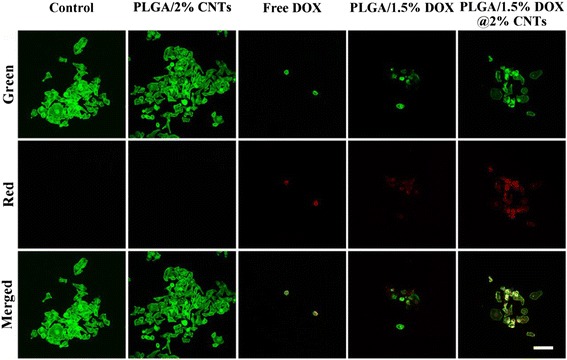
Confocal laser scanning microscopy images of HeLa cells treated with PLLA/2 % CNTs, free DOX, PLLA/1.5 % DOX, and PLLA/1.5 % DOX@2 % CNTs. DOX concentration was 25 μg/mL. The red fluorescence indicates the released DOX. The green fluorescence represents Alexa Fluor 488® phalloidin-stained F-actin. Scale bars = 100 μm