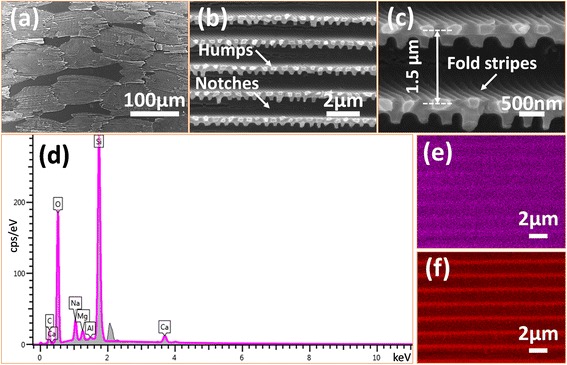
Fig. 4.

FESEM images and EDS spectrum of the SiO2 negative replica. a Lower magnification image. It could be found that the scales were still arranged in rows. However, they were no longer overlapped with each other. b Medium magnification image of the SiO2 negative replica. It can be observed that notches are lying in parallel, with humps of different shapes between them. c High-magnification images of the replica surface. The sizes and shapes of the humps were in conformity with those of the pores shown in Fig. 2c. d The EDS spectrum showed the main elements constituting the SiO2 negative replicas. e, f The scanning maps of silicon and oxygenium demonstrated the distribution of silicon and oxygenium, which was consistent with the structures shape of the subwavelength antireflective nanoditches arrays
