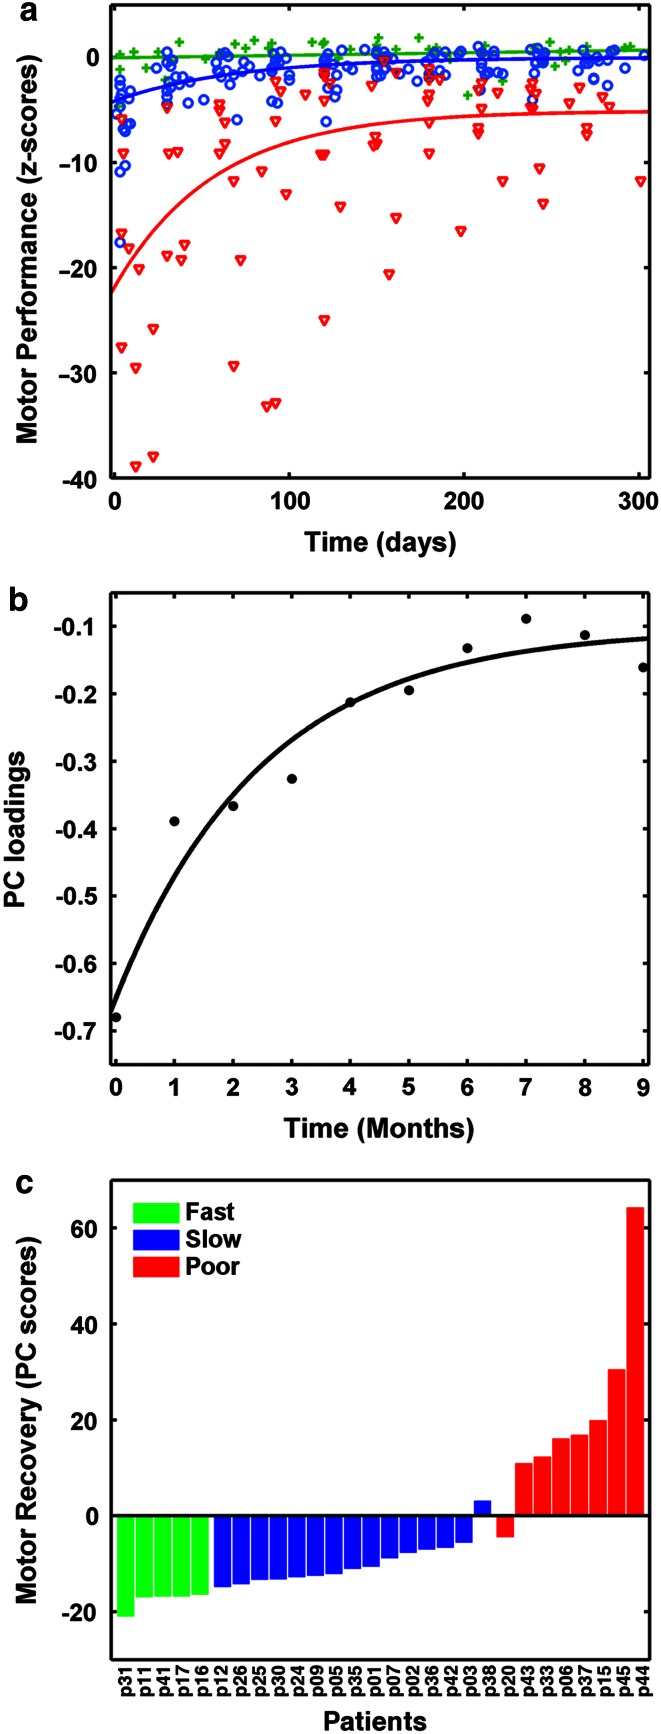
Fig. 1.
Results of motor recovery analysis. a Summarizes the single-subject motor performance values on the “picking small objects” task (z-scores against time) and modelled average recovery trajectories of each patient subgroup (green crosses, fast recovery; blue circles, slow recovery; red triangles, impaired recovery). A z-score of zero indicates the mean of healthy control performance. b Depicts the loadings of the first principal component (PC), and their associated exponential fit. Loadings were calculated from PSO scores measured at each monthly visit (0, baseline; 9, final visit after 9 months). c Shows the single-subject PC scores. These values correspond to the projection of each subjects’ recovery trajectory on the first PC. Lower values indicate faster recovery, higher values increasing chronic deficit. Recovery subgroups cluster along a continuum of motor recovery, with some degree of overlap between slow and poor recovery subgroups. Patient identification number as in Table 1

