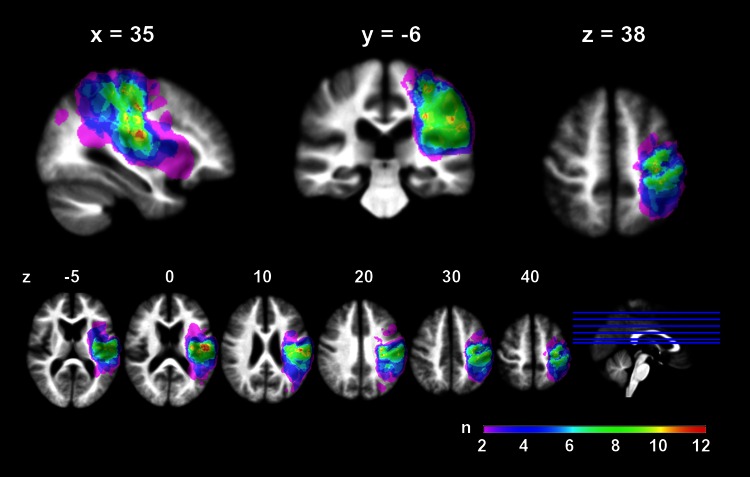
Fig. 2.
Lesion distribution. A summary lesion map of all individual lesions rendered onto sagittal, coronal, and axial sections (upper row) and a series of axial slices (lower row) of an average anatomical image from all patients. Colour code indicates number (n) of patients with lesion at a given voxel. The colour scale for the lesion overlay map has an upper limit of 12, representing the greatest overlap among the patients in the precentral gyrus (slices z = 0–20). All images are in neurological convention (left side of the image is left side of the brain). Coordinates are in MNI space (mm)

