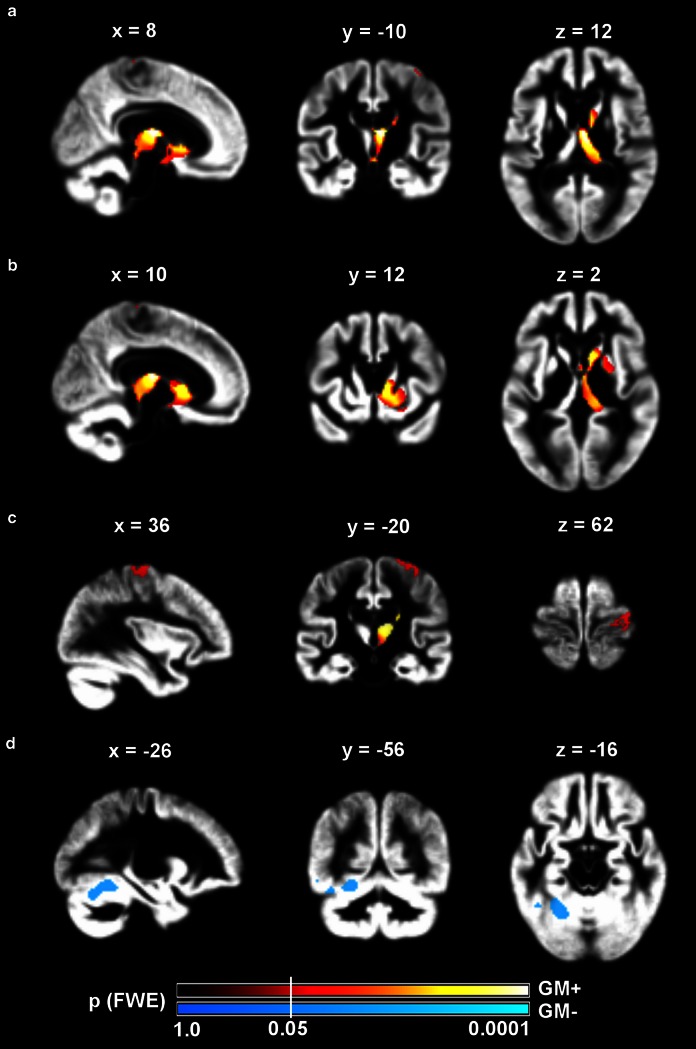
Fig. 3.
Statistical parametric maps of grey matter volumetric change across all patients. Significant clusters of grey matter volume increase (GM+, hot colours) or decrease (GM−, cool colours) rendered on sagittal, coronal, and axial sections (from left to right) of an average grey matter segmentation. Sections are chosen to show the maximum effect on the ipsilesional mediodorsal thalamus (a), head of the caudate nucleus (b), precentral gyrus (c), and contralesional cerebellum (d). Colour map indicates family-wise error (FWE) corrected p values at every voxel. Statistical threshold was set at p(FWE) < .05 (white vertical line across colour bars). All images are in neurological convention (left side of the image is left side of the brain). Coordinates are in MNI space (mm)

