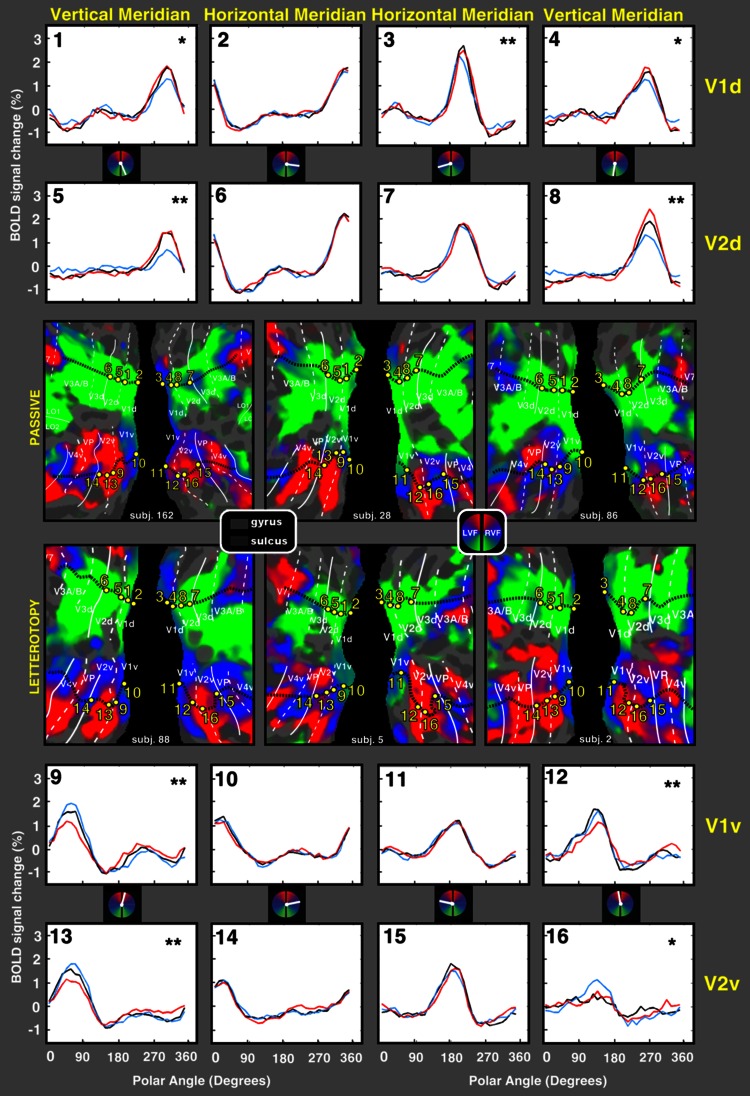
Fig. 4.
Averaged polar angle responses, during gaze-up, gaze-center, and gaze-down conditions, across all six subjects. In the center, the flattened representations of the right and left occipital cortices of all six participants, overlaid with a polar angle map derived from all available gain field data (passive, top row; letterotopy, bottom row). The polar angle color-code and symbol conventions are as in previous figures. Asterisks indicate significant (*p < 0.05, **p < 0.001 Bonferroni corrected) interaction between polar angle and gaze position

