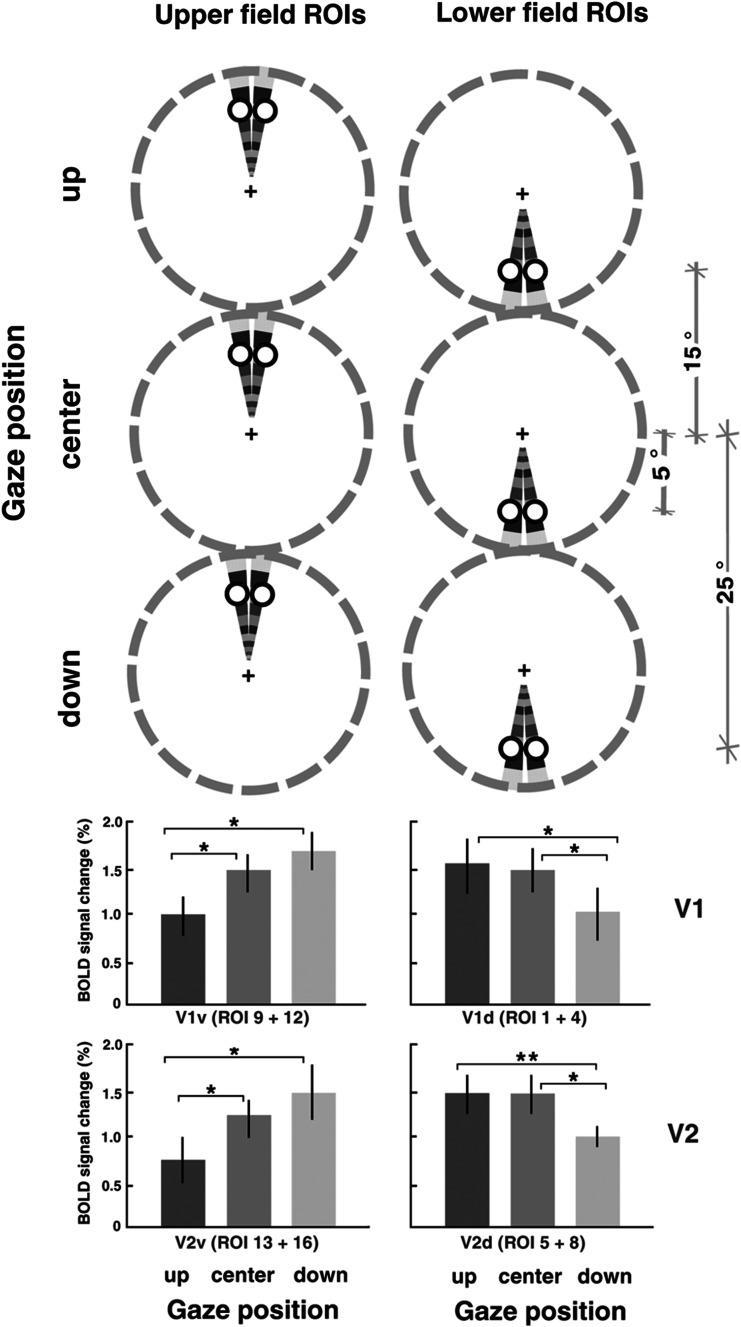
Fig. 5.
Averaged response amplitude during gaze-up, gaze-center, and gaze-down conditions on the peak response, across all six subjects. The vertically aligned dashed circles in each column represent the three different gaze position conditions (−20°, 0°, +20° vertical). Visual stimulation consisted of a flickering checkerboard wedge rotating in a counterclockwise direction. White points on the wedges indicate the (single-voxel size) regions of interest. For each visual cortical area four regions have been sampled near the vertical meridian (V1: region 1, 4, 9, 12; V2: region 5, 8, 13, 16; see Fig. 2 for further ROIs details). Graph bars indicate BOLD signal change in the gaze-up, gaze-center, and gaze-down conditions in cortical visual areas V1 and V2. The two panels represent the set of points sampled close to the vertical meridian in the upper and lower visual field, respectively. Error bars represent ± SEM (*p < 0.05)

