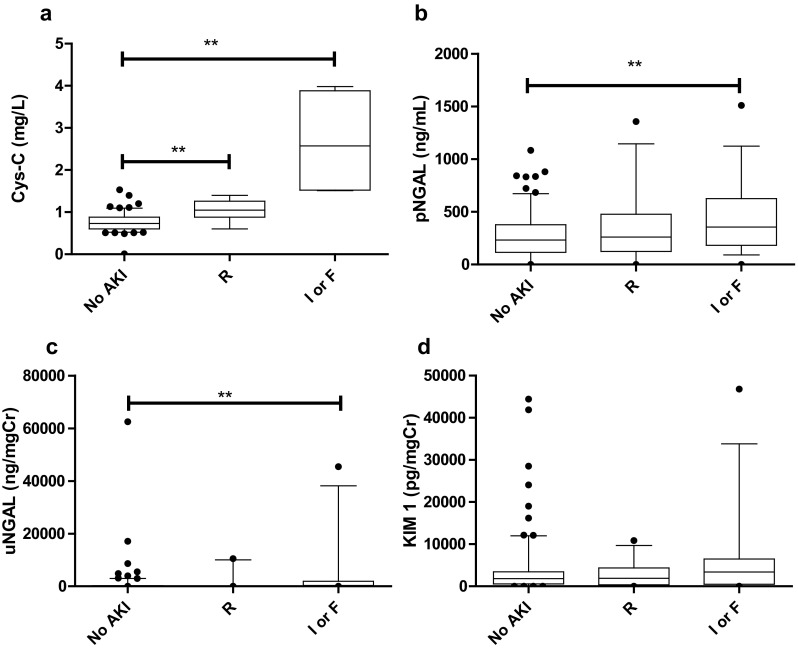
Fig. 4.

Box and whisker graph showing biomarker levels according to pRFILE stratum. a Cys-C levels were significantly higher during periods of pRIFLE Risk (R) compared to no acute kidney injury (AKI) (No AKI), and during periods of pRIFLE Injury or Failure (I or F) compared to pRIFLE R (p < 0.05). b, c pNGAL (b; p = 0.027) and uNGAL (c; p = 0.0079) levels were significantly higher in periods of pRIFLE I or F compared to no AKI. d No significant difference in KIM-1 levels were observed (p = 0.2108). In all plots, the box extends from the 25th to 75th data percentiles; line in the middle of box is plotted at the median, box plot whiskers denote 5th and 95th data percentiles
