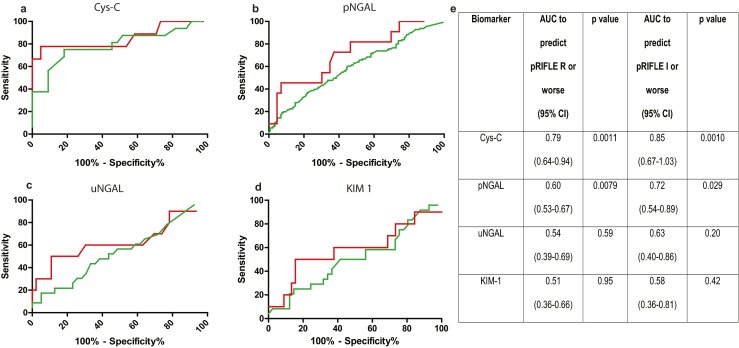
Fig. 5.

Receiver operating characteristic (ROC) curve analysis was performed to evaluate the ability of Cys-C (a), pNGAL (b), uNGAL (c) and KIM-1 (d) to diagnose acute kidney injury (AKI). Green lines ROC curves showing biomarker sensitivity and specificity if an AKI definition of pRIFLE R or worse is used, red lines ROC curves illustrating biomarker performance if an AKI definition of pRFILE I or worse is used. e Area under the curve (AUC) values. CI Confidence interval
